Getting started with Metasploit

Many tutorials about Metasploit are available on internet (as well many books and trainings), but most of them confusing beginners. My intention with the following content is to create a simple environment (via Docker) and to show the use of this. In order not to make it too boring, I also show some important basics for Metasploit itself.

Objective

Learn how to create and use a simple training environment as well as learn first basic metasploit commands.

Precondition

Docker (latest) installed

Prepare environment

As mentioned already we will use Docker. The benefits here are this does not need installations and no local installed Anti-virus tool does disturb and complain.

# create working directory and change location
$ mkdir -p ~/Projects/Metasploit/msf && cd ~/Projects/Metasploit

# list directories/files (optional)
$ tree .
|__msf

# create network
$ docker network create --subnet=172.18.0.0/16 metasploit

# check created network (optional)
$ docker network ls --filter driver=bridge --no-trunc

# run postgres container
$ docker run -d --name postgres --ip 172.18.0.2 --network metasploit -e POSTGRES_PASSWORD=postgres -e POSTGRES_USER=postgres -e POSTGRES_DB=msf -v "$(pwd)/msf/database:/var/lib/postgresql/data" postgres:11-alpine

# show logs (optional)
$ docker logs postgres

# run metasploit container
$ docker run --name metasploit --ip 172.18.0.3 --network metasploit -it -v "$(pwd)/msf/user:/home/msf/.msf4" -p 8443-8500:8443-8500 metasploitframework/metasploit-framework ./msfconsole

# list latest created containers (optional in different tty)
$ docker ps -n 2

Connect database

In this environment we need to connect the Postgres database manually.

# check database status (optional)
msf5 > db_status

# connect (if broken)
msf5 > db_connect postgres:postgres@172.18.0.2:5432/msf

Prepare Metasploit workspace

This is an very important step! It gets often forgotten in other tutorials. Without this steps you will have later many problems/confusions and may don’t understand why.

# list all workspaces
msf5 > workspace

# create new workspace
msf5 > workspace -a hackthissite.org

# list all hosts (optional)
msf5 > hosts

# list all services (optional)
msf5 > services

Some scanner actions

As promised here some other basics.

# search for scanner with name:tcp
msf5 > search auxiliary name:tcp

# select tcp portscanner module
msf5 > use auxiliary/scanner/portscan/tcp

# show detailed information (optional)
msf5 auxiliary(scanner/portscan/tcp) > info

# show options
msf5 auxiliary(scanner/portscan/tcp) > options

# set needed values
msf5 auxiliary(scanner/portscan/tcp) > set RHOSTS hackthissite.org
msf5 auxiliary(scanner/portscan/tcp) > set PORTS 20-100
msf5 auxiliary(scanner/portscan/tcp) > set THREADS 6

# execute scan
msf5 auxiliary(scanner/portscan/tcp) > run

# move out of the current context
msf5 auxiliary(scanner/portscan/tcp) > back

# list all hosts
msf5 > hosts

# list all services
msf5 > services

Stop and restart the environment

# stop metasploit container
msf5 > exit

# stop postgres container
$ docker stop postgres

# check container status (optional)
$ docker ps -a
# change directory (if not done already)
$ cd ~/Projects/Metasploit

# start postgres container (first)
$ docker start postgres

# start metasploit container
$ docker start metasploit

# run msfconsole (without banner)
$ docker exec -ti metasploit ./msfconsole -q

# connect to postgres (if broken)
msf5 > db_connect postgres:postgres@172.18.0.2:5432/msf
Connected to Postgres data service: 172.18.0.2/msf

# list workspaces
msf5 > workspace
  hackthissite.org
* default

# select specific workspace
msf5 > workspace 'hackthissite.org'
[*] Workspace: hackthissite.org

Now you have everything you need for the next tutorials.
Create QA dashboards with Grafana (Part 1)

Since I have my new role (Head of QA), many employees constantly want metrics from me. That means a lot of work for me. But since I do not always want to deal with such things, I have searched for a simpler way. So the question was – how can I deliver this data at any time and possibly from different sources (eq. JIRA, pipelines, test results, Salesforce, etc.)? Hmmm … Grafana is awesome – not only for DevOps! So in this tutorial series, I’d like to show you how to create nice and meaningful dashboards for your QA metrics in Grafana.

What you need?

  • Docker installed (latest version)
  • Bash (min. 3.2.x)

Prepare the project

In order to create dashboards in Grafana, you need a small environment (Grafana/InfluxDB) as well as some data. The next steps will help you to create them. The environment/services are simulated by docker containers. For the fictitious data, just use the bash script which I created for this tutorial.

# create project
$ mkdir -p ~/Projects/GrafanaDemo && cd ~/Projects/GrafanaDemo

# create file docker-compose.yml
$ touch docker-compose.yml

# create file CreateData.sh
$ touch CreateData.sh

# change file permissions
$ chmod u+x CreateData.sh

Now copy/paste the content of the two files with your favorite editor. The content of docker-compose.yml.

version: '3'

networks:
  grafana-demo:
    driver: bridge
    ipam:
      driver: default
      config:
        - subnet: 10.1.0.0/24

services:

  influxdb:
    container_name: influxdb
    networks:
      grafana-demo:
        ipv4_address: 10.1.0.10
    ports:
      - '8086:8086'
    image: influxdb

  grafana:
    container_name: grafana
    networks:
      grafana-demo:
        ipv4_address: 10.1.0.20
    ports:
      - '3000:3000'
    image: grafana/grafana
    environment:
      - 'GF_INSTALL_PLUGINS=grafana-piechart-panel'
    depends_on:
      - influxdb

And here the content of CreateData.sh.

#!/usr/bin/env  bash

# shell options
#set -x
#set -v
set -e
set -u
set -f

# magic variables
declare -r OPTS="htsp"
declare -a TIMESTAMPS
declare -a OPTIONS=(false false false)
declare -r -a DATABASES=(test_db support_db pipeline_db)
declare -r -a TESTER=(Tina Robert)
declare -r -a SUPPORTER=(Jennifer Mary Tom)
declare -r -a STAGES=(S1 S2 S3)
declare -r -a BUILD=(SUCCESS FAILURE ABORTED)
declare -r -i SUCCESS=0
declare -r -i BAD_ARGS=85
declare -r -i NO_ARGS=86

# functions
function usage() {
  local count
  local file_name=$(basename "$0")

  printf "Usage: %s [options...]\n" "$file_name"
  for (( count=1; count<${#OPTS}; count++ )); do
    printf "%s\tcreate %s and content\n" "-${OPTS:$count:1}" "${DATABASES[$count - 1]}"
  done
  exit "$SUCCESS"
}

function bad_args() {
  printf "Error: Wrong arguments supplied\n"
  usage
  exit "$BAD_ARGS"
}

function no_args() {
  printf "Error: No options were passed\n"
  usage
  exit "$NO_ARGS"
}

function create_timestamp_array() {
  local counter=1
  local timestamp

  while [ "$counter" -le 30 ]; do
    timestamp=$(date -v -"$counter"d +"%s")
    TIMESTAMPS+=("$timestamp")
    ((counter++))
  done
}

function curl_post() {
  local url=$(printf 'http://localhost:8086/write?db=%s&precision=s' "$2")

  curl -i -X POST "$url" --data-binary "$1"
}

function create_test_results() {
  local passed
  local failed
  local skipped
  local count
  local str

  for count in "${TESTER[@]}"; do
    passed=$((RANDOM % 30 + 20))
    failed=$((RANDOM % passed))
    skipped=$((passed - failed))
    str=$(printf 'suite,app=demo,qa=%s passed=%i,failed=%i,skipped=%i %i' "$count" "$passed" "$failed" "$skipped" "$1")
    echo "$2: $str"
    curl_post "$str" "$2"
  done
}

function create_support_results() {
  local items=(1 2 none)
  local in
  local out
  local str
  local count

  for count in "${SUPPORTER[@]}"; do
    in=$((RANDOM % 25))
    out=$((RANDOM % 25))
    str=$(printf 'tickets,support=%s in=%i,out=%i %i' "$count" "$in" "$out" "$1")
    echo "$2: $str"
    curl_post "$str" "$2"
  done
}

function create_pipeline_results() {
  local status
  local duration
  local str
  local count

  for count in "${STAGES[@]}"; do
    status=${BUILD[$RANDOM % ${#BUILD[@]} ]}
    duration=$(( 3+RANDOM%(3-17) )).$(( RANDOM%999 ))
    str=$(printf 'pipeline,stage=%s status="%s",duration=%s %i' "$count" "$status" "$duration" "$1")
    echo "$2: $str"
    curl_post "$str" "$2"
  done
}

function main() {
  local repeat=$(printf '=%.0s' {1..80})

  create_timestamp_array

  for ((i = 0; i < ${#OPTIONS[@]}; ++i)); do
    if [[ "${OPTIONS[$i]}" == "true" ]]; then
      printf "Create database: %s\n" "${DATABASES[$i]}"
      printf "%s\n" "$repeat"
      curl -i -X POST http://localhost:8086/query --data-urlencode "q=CREATE DATABASE ${DATABASES[$i]}"
      printf "Generate content of database: %s\n" "${DATABASES[$i]}"
      printf "%s\n" "$repeat"
      for item in "${TIMESTAMPS[@]}"; do
        if [[ "${DATABASES[$i]}" == "${DATABASES[0]}" ]]; then
          create_test_results "$item" "${DATABASES[$i]}"
        fi
        if [[ "${DATABASES[$i]}" == "${DATABASES[1]}" ]]; then
          create_support_results "$item" "${DATABASES[$i]}"
        fi
        if [[ "${DATABASES[$i]}" == "${DATABASES[2]}" ]]; then
          create_pipeline_results "$item" "${DATABASES[$i]}"
        fi
      done
    fi
  done
}

# script arguments
while getopts "$OPTS" OPTION; do
  case "$OPTION" in
    h)
        usage;;
    t)
        OPTIONS[0]="true";;
    s)
        OPTIONS[1]="true";;
    p)
        OPTIONS[2]="true";;
    *)
        bad_args;;
  esac
done

if [ $OPTIND -eq 1 ]; then
  no_args
fi

# main function
main

# exit
exit "$SUCCESS"

Start environment and create data

Once the project and the files have been created, you can build and start the environment. For this you use Docker Compose.

# validate docker-compose file (optional)
$ docker-compose config

# run environment
$ docker-compose up -d

# get IP from grafana container (optional)
$ docker inspect -f '{{range .NetworkSettings.Networks}}{{.IPAddress}}{{end}}' grafana
10.1.0.20

# get IP from influxdb container (optional)
$ docker inspect -f '{{range .NetworkSettings.Networks}}{{.IPAddress}}{{end}}' influxdb
10.1.0.10

# show created docker network (optional)
$ docker network ls | grep -i 'grafana*'

# show docker containers (optional)
$ docker ps -a | grep -i 'grafana\|influxdb'

In next step you create the InfluxDB databases (incl. fictitious measurements, series and data) via Bash script.

# ping influxdb (optional)
$ curl -I http://localhost:8086/ping

# show help (optional)
$ ./CreateData.sh -h

# create databases and contents (execute only 1x)
$ ./CreateData.sh -t -s -p

# show current databases (optional)
$ curl -G http://localhost:8086/query?pretty=true --data-urlencode "q=SHOW DATABASES"

# show test_db series (optional)
$ curl -G http://localhost:8086/query?pretty=true --data-urlencode "db=test_db" --data-urlencode "q=SHOW SERIES"

# show test_db measurements (optional)
$ curl -G http://localhost:8086/query?pretty=true --data-urlencode "db=test_db" --data-urlencode "q=SHOW MEASUREMENTS"

Note: You could use influx command to administrate InfluxDB directly.

# exec docker container
$ docker exec -ti influxdb influx

# list all databases
> show databases

# use specific database test_db
> use test_db

# show series of test_db
> show series

# show measurements of test_db
> show measurements

# drop measurements of test_db (in case something went wrong)
> drop measurement suite

Okay the environment preparation is done. Now start Grafana in browser.

# open Grafana in browser
$ open http://localhost:3000

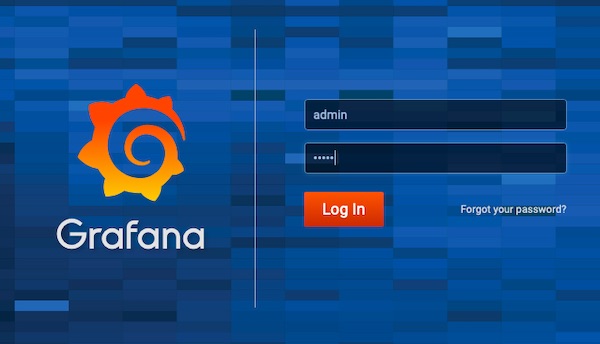
New Grafana Login

The default username and password is “admin:admin“. Note, if you use docker-compose down you have to repeat most of steps like data creation. Better use docker-compose stop! … See you in 2nd part – where we add data sources and create dashboards.

CURL visualization via httpstat

CURL is awesome … but sometimes the feature for visualization of statistics is missing. Exactly here helps httpstat as an wrapper.

httpstat is available for different languages:

Prepare project

Since I am a Python lover I will also work with my favorite language provided by Xiao Meng. It’s a single file with no dependencies and compatible to Python 2.7 and 3.

# create project folder
$ mkdir -p ~/Projects/httpstat && cd ~/Projects/httpstat

# download python script
$ curl -C - -O https://raw.githubusercontent.com/reorx/httpstat/master/httpstat.py

# change file permission
$ chmod u+x httpstat.py

Usage examples

# show help
$ python httpstat.py --help

# show simple GET statistics
$ python httpstat.py -k https://softwaretester.info/

# show html body (truncated)
$ export HTTPSTAT_SHOW_BODY=true
$ python httpstat.py -k https://softwaretester.info/

# show download and upload speed
$ export HTTPSTAT_SHOW_SPEED=true
$ python httpstat.py -k https://softwaretester.info/

Note: httpstat has a bunch of environment variables, please use help!

Record and share terminal sessions

Sometimes it is so boring to tell other software testers what to do … and nobody read documentations. Here now a easy solution! Just record and share your terminal sessions.

Installation

# install Python3 with pip (on Debian 8)
$ apt-get install -y python3 python3-pip

# verify installation
$ python3 --version && pip3 --version

# install asciinema
$ apt-get install -y asciinema

# verify installation
$ asciinema --version

Note: read the documentation of asciinema for other OS!

Usage

# start recording
$ asciinema rec

# do some great stuff on new shell instance
...

# stop recording (Ctrl-D)
$ exit

# open/send URL

Tip: Sensitive data should be shared directly (via JSON file)!

# record to local file
$ asciinema rec record.json

# distribute in any way
...

# play local record
$ asciinema play record.json

Automate Bash testing with Bats

With Bats (Bash Automated Testing System) it is easy to automate Bash and command line testing. It is an awesome open source framework written in Bash by Sam Stephenson. In combination with Jenkins you are able to use it via build.

Installation

# clone from github
$ git clone https://github.com/sstephenson/bats.git

# change directory
$ cd bats

# start installation
$ sudo ./install.sh /usr/local

Usage

# create new project
$ mkdir ~/Project/Bats && cd ~/Projects/Bats

# create Bats file
$ vim test.bats

# execute test
$ bats test.bats
...
✓ Simple check for date command
✓ Check for current user
- Test for something that does not exist (skipped: This test is skipped)
✓ Test for something that should not exist
✓ Check for individual line of output

5 tests, 0 failures, 1 skipped

# execute test with TAP output
$ bats --tap test.bats
...
1..5
ok 1 Simple check for date command
ok 2 Check for current user
ok 3 # skip (This test is skipped) Test for something that does not exist
ok 4 Test for something that should not exist
ok 5 Check for individual line of output

Example Bats file

#!/usr/bin/env bats

@test "Simple check for date command" {
  date
}

@test "Check for current user" {
  result="$(whoami)"
  [ "$result" == "lupin" ]
}

@test "Test for something that does not exist" {
  skip "This test is skipped"
  ls /test/no/test
}

@test "Test for something that should not exist" {
  run ls /test/no
  [ "$status" -eq 1 ]
}

@test "Check for individual line of output" {
  run ping -c 1 google.com
  [ "$status" -eq 0 ]
  [ "${lines[3]}" = "1 packets transmitted, 1 packets received, 0.0% packet loss" ]
}

Note: There is much more! Read documentation and have a look on projects which are using it!

Monitor multiple remote log files with MultiTail

With MultiTail you are able to view one or multiple log files (on remote engines). Therefore it creates multiple split-windows on your console. You can configure these! To see all features look here.

Installation

# install on Mac OS via Mac Ports
$ sudo port install multitail

# install on Mac OS via Homebrew
$ sudo brew install multitail

# install on RHEL/CentOS/Fedora
$ yum install -y multitail

# install on Debian/Ubuntu/Mint
$ sudo apt-get install multitail

Examples

# example for two log-files
$ multitail log-file_a log-file_b

# example for two log-files and two columns
$ multitail -s 2 log-file_a log-file_a

# example for two log-files and different colors
$ multitail -ci green log-file_a -ci yellow -I log-file_a

# example for one log file on remote
$ multitail -l "ssh -t <user>@<host> tail -f log-file"

# example for four log files on remote
$ multitail -l "ssh -l <user> <host> tail -f log-file_a" -l "ssh -l <user> <host> tail -f log-file_b" -l "ssh -l <user> <host> tail -f log-file_c" -l "ssh -l <user> <host> tail -f log-file_d"

Note

If you look on multiple files at same time with MultiTail – just hit the “b” key to select the window, with up/down keys you can scroll.

Lynx text based web browser

Lynx can be used to check web site for accessibility, performance and SEO analysis.

Install Lynx

# install with yum
$ yum install -y lynx

# install with apt-get
$ apt-get install -y lynx

# install with Mac ports
$ sudo port install lynx

Use Lynx

# textual representation of the web page
$ lynx http://softwaretester.info

# print response header
$ lynx -head http://softwaretester.info
$ lynx -dump -head http://softwaretester.info

# show source code
$ lynx -source http://softwaretester.info

# grep links to STDOUT
$ lynx -dump http://softwaretester.info | grep "http:"

# count internal links
$ lynx -dump http://softwaretester.info | grep -o "http://softwaretester.info" | uniq | wc -l

# store external links into file
$ lynx -dump "http://softwaretester.info" | grep -o "http:.*" | grep -v "http://softwaretester.info*" > file.txt

Scan Wifi from Terminal

There is a command line tool that allows you to work with the wireless connection on your Mac. The tool is very useful but by default hidden and not well documented.

airport

# show airport help
$ /System/Library/PrivateFrameworks/Apple80211.framework/Versions/Current/Resources/airport --help

networksetup

# find device names
$ networksetup -listallhardwareports

Turn on/off and join

# turn it off
$ networksetup -setairportpower en0 off

# turn it on
$ networksetup -setairportpower en0 on

# join a network
$ networksetup -setairportnetwork en0 <SSID> <Password>

Let`s start a wifi scan and get some information

# scan with interface en0
$ /System/Library/PrivateFrameworks/Apple80211.framework/Versions/Current/Resources/airport en0 --scan

# show information of en0
$ /System/Library/PrivateFrameworks/Apple80211.framework/Versions/Current/Resources/airport en0 --getinfo

Note: If do not specify the interface, airport will use the first wifi interface on the system.

Easy way

# create a symbolic link to the command
$ sudo ln -s /System/Library/PrivateFrameworks/Apple80211.framework/Versions/Current/Resources/airport /usr/sbin/airport

# after link created start the scan
$ airport en0 --scan

Sniff

# find WEP
$ airport en0 scan | grep WEP

# start sniff on channel
$ airport en0 sniff 6

The captured packets you will find as “/tmp/airportSniffXXXXXX.cap”.