macOS, Docker, Prometheus and Grafana

I like Grafana … the dashboards are just cool! Here (again) a tutorial about docker monitoring. In less minutes you should be done. As a comment … for Linux and Windows you can do that too! There are only partial changes.

Prepare Project

# create project
$ mkdir -p ~/Projects/DPG && cd ~/Projects/DPG

# show current IP
$ ifconfig | grep "inet " | grep -v 127.0.0.1

# create and edit prometheus.yml
$ vim prometheus.yml

Replace <yourLocalIP> with your IP. On Docker website you can find templates for Linux and Windows, too!

# my global config
global:
  scrape_interval:     15s # Set the scrape interval to every 15 seconds. Default is every 1 minute.
  evaluation_interval: 15s # Evaluate rules every 15 seconds. The default is every 1 minute.
  # scrape_timeout is set to the global default (10s).

  # Attach these labels to any time series or alerts when communicating with
  # external systems (federation, remote storage, Alertmanager).
  external_labels:
      monitor: 'codelab-monitor'

# Load rules once and periodically evaluate them according to the global 'evaluation_interval'.
rule_files:
  # - "first.rules"
  # - "second.rules"

# A scrape configuration containing exactly one endpoint to scrape:
# Here it's Prometheus itself.
scrape_configs:
  # The job name is added as a label `job=<job_name>` to any timeseries scraped from this config.
  - job_name: 'prometheus'

    # metrics_path defaults to '/metrics'
    # scheme defaults to 'http'.

    static_configs:
      - targets: ['localhost:9090']

  - job_name: 'docker'
         # metrics_path defaults to '/metrics'
         # scheme defaults to 'http'.

    static_configs:
      - targets: ['<yourLocalIP>:9323']

Configure Docker

This step is very easy. Just open Docker “Preferences” and specify in section “Daemon” -> “Advanced” the metrics-address. Just ensure that you use valid JSON!

macOS Docker Metrics

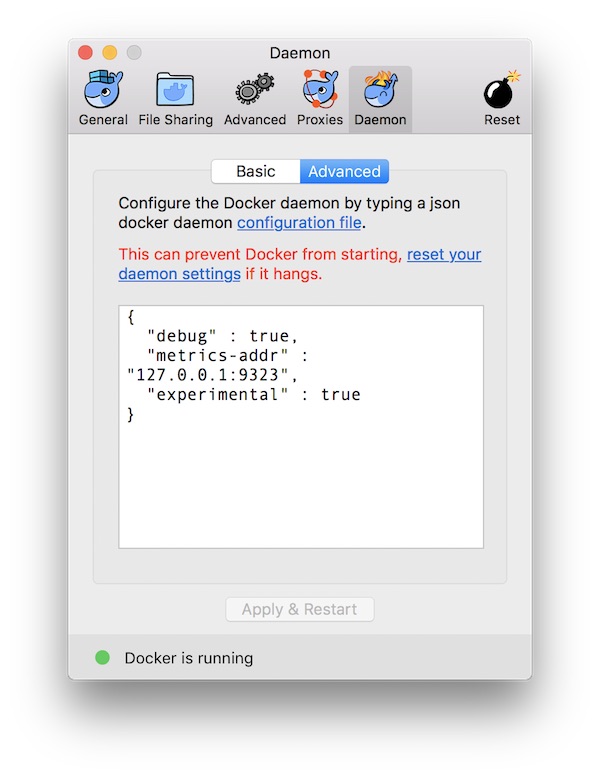
When you are done, press “Apply and Restart” button.

# view Docker metrics in browser
$ open -a Safari http://127.0.0.1:9323/metrics

Prepare Prometheus

# run Prometheus
$ docker run --name prometheus -p 9090:9090 -v $PWD/prometheus.yml:/etc /prometheus/prometheus.yml prom/prometheus

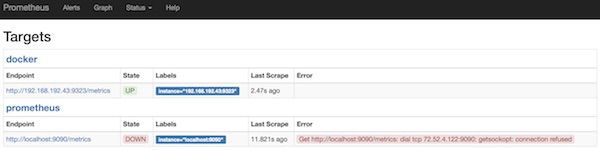
# open Prometheus WebUI
$ open -a Safari http://localhost:9090/targets

# get Prometheus IP
$ docker inspect --format '{{ .NetworkSettings.IPAddress }}' prometheus

Note: The space after /etc is just because of security settings of my provider! Please remove the space.

prometheus WebUI

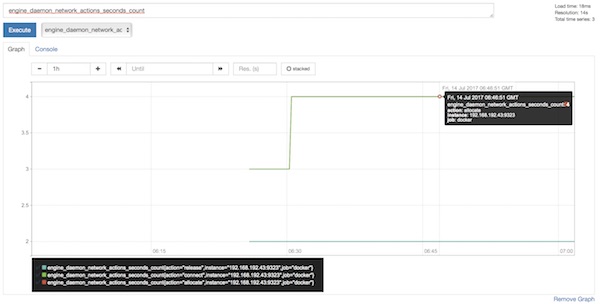
Just for fun you can create already some graphs in Prometheus.

prometheus Graph

Prepare and run Grafana

# run Grafana
$ docker run --name grafana -i -p 3000:3000 grafana/grafana

# open Grafana WebUI and login (admin:admin)
$ open -a Safari http://localhost:3000

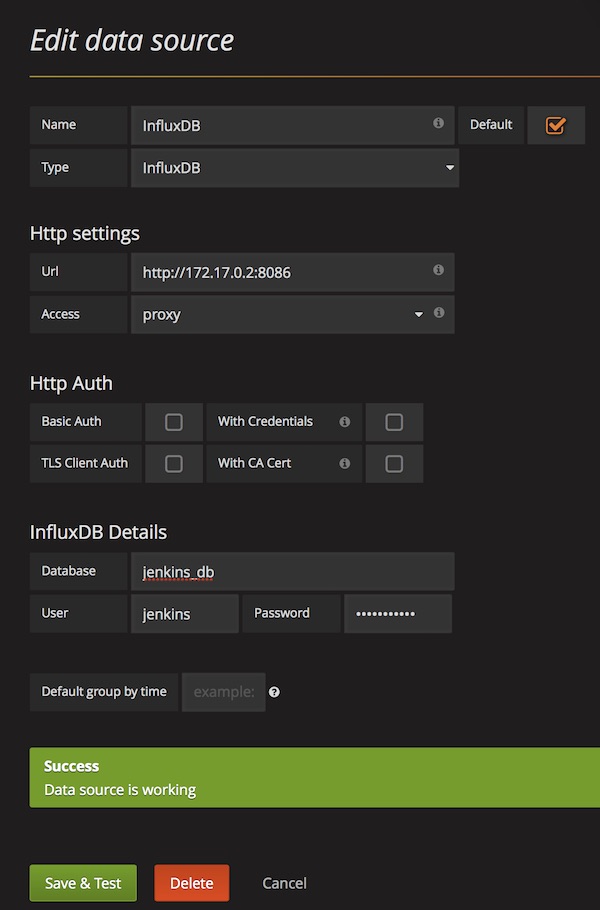
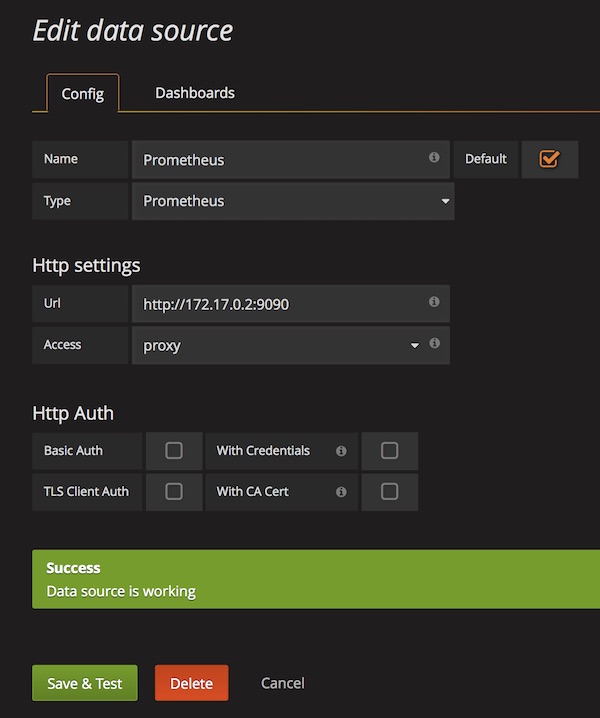
After login (admin:admin) configure new DataSource for Prometheus.

Grafana DataSource Prometheus

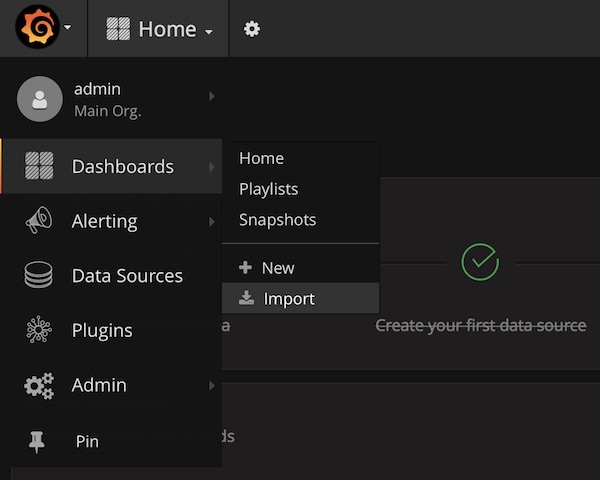
Import Dashboard (ID: 1229)

Grafana Import Dashboard

… enter ID 1229 …

Grafana Dashboard Search

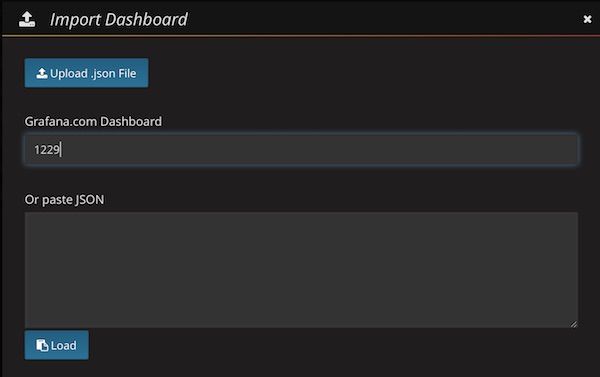
… be patient (don’t press any button) …

Docker Engine Metrics Dashboard

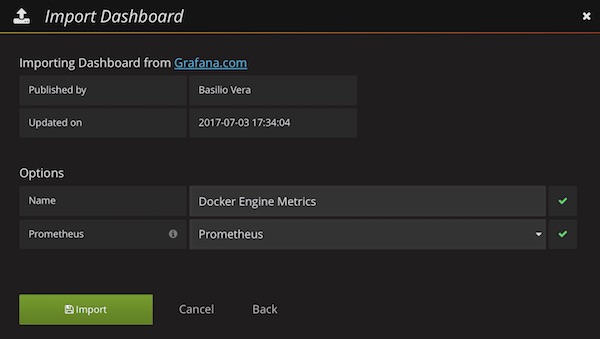
Select already created DataSource (Prometheus) and press “Import” button. Now you should see the awesome Grafana Dashboard.

Jenkins, InfluxDB and Grafana

Today an basic introduction to Jenkins, InfluxDB and Grafana. Docker is used to save some time. Okay,… let’s start.

Preparation

# create project and change directory
$ mkdir ~/Projects/JIG/influxdb && cd ~/Projects/JIG/

# download official jenkins image (latest)
$ docker pull jenkins

# download official influxdb image (latest)
$ docker pull influxdb

# download official grafana image (latest)
$ docker pull grafana/grafana

# list docker images
$ docker images
...
REPOSITORY          TAG                 IMAGE ID            CREATED             SIZE
jenkins             latest              59b08e8f6e37        4 days ago          704 MB
grafana/grafana     latest              2cdb407c0fa4        7 days ago          286 MB
influxdb            latest              fad81160f2de        13 days ago         224 MB
...

Jenkins preparation

# start Jenkins
$ docker run --name jenkins -p 8080:8080 jenkins

# copy password from cli
...
*************************************************************

Jenkins initial setup is required. An admin user has been created and a password generated.
Please use the following password to proceed to installation:

b49ffa5749724d61b43d3a159b181133
...

Now open your favorite browser with URL http://localhost:8080 and unlook Jenkins with following steps.

unlook jenkins

  1. unlook with password from cli
  2. install suggested plugins
  3. create your admin user
  4. start using jenkins

Next, the InfluxDB plug-in must be installed.

influxdb plugin jenkins

InfluxDB preparation

# start InfluxDB
$ docker run --name influxdb -p 8086:8086 -v $PWD/influxdb:/var/lib/influxdb influxdb

# check current configuration (optional)
$ docker exec -i influxdb influxd config

# create new user
$ curl -G http://localhost:8086/query --data-urlencode "q=CREATE USER jenkins WITH PASSWORD 'password123' WITH ALL PRIVILEGES"

# create database for jenkins
$ curl -G http://localhost:8086/query -u jenkins:password123 --data-urlencode "q=CREATE DATABASE jenkins_db"

# show users (optional)
$ curl -G http://localhost:8086/query -u jenkins:password123 --data-urlencode "q=SHOW USERS"
...
{"results":[{"statement_id":0,"series":[{"columns":["user","admin"],"values":[["jenkins",true]]}]}]}
...

# show databases (optional)
$ curl -G http://localhost:8086/query -u jenkins:password123 --data-urlencode "q=SHOW DATABASES"
...
{"results":[{"statement_id":0,"series":[{"name":"databases","columns":["name"],"values":[["_internal"],["jenkins_db"]]}]}]}
...

# show measurements
$ curl -G http://localhost:8086/query -u jenkins:password123 --data-urlencode "db=jenkins_db" --data-urlencode "q=SHOW MEASUREMENTS"
...
{"results":[{"statement_id":0}]}
...

Connect Jenkins with InfluxDB

# start jenkins container (if stopped)
$ docker start jenkins

# show ip of influxdb container
$ docker inspect --format '{{ .NetworkSettings.IPAddress }}' influxdb
...
172.17.0.2
...

Add new InfluxDB target on Jenkins

jenkins influxdb settings

Save and create a new freestyle job. For example with following configuration.

jenkins job influxdb

When you are done, run the job.

# show measurements
$ curl -G http://localhost:8086/query -u jenkins:password123 --data-urlencode "db=jenkins_db" --data-urlencode "q=SHOW MEASUREMENTS"
...
{"results":[{"statement_id":0,"series":[{"name":"measurements","columns":["name"],"values":[["jenkins_data"]]}]}]}
...

# run select statement (optional)
$ curl -G http://localhost:8086/query -u jenkins:password123 --data-urlencode "db=jenkins_db" --data-urlencode "q=SELECT * FROM jenkins_data"
...
{"results":[{"statement_id":0,"series":[{"name":"jenkins_data","columns":["time","build_number","build_result","build_result_ordinal","build_status_message","build_successful","build_time","last_stable_build","last_successful_build","project_build_health","project_name","project_name_1"],"values":[["2017-06-08T17:27:24.487Z",9,"SUCCESS",0,"stable",true,16,9,9,100,"test","test"]]}]}]}
...

Add Grafana

# start containers (if stopped)
$ docker start influxdb && docker start jenkins

# run grafana container
$ docker run --name grafana -i -p 3000:3000 grafana/grafana

Open you browser with URL http://localhost:3000, login with credentials (admin/admin) and add a new InfluxDB data source.

grafana data source

From now on, you can create and share dashboards in Grafana, which shows all Jenkins metrics.

Test your infrastructure

Infrastructures can be very big. Luckily, there are provisioner like Chef, Salt, Ansible and etc. These provisioners can be very complex and possibly the developer has done something wrong. Therefore the infrastructure has to be tested! Tools like goss, Serverspec and Testinfra helps testers to validate. This tutorial show the first steps with Testinfra.

Testinfra is written in Python very small and easy to understand. Here is the GitHub repository.

Precondition

  • Vagrant (min. 1.9.3) installed
  • Python (min. 2.7) installed
  • pip (min. 9.0.1) and virtualenv (min. 15.1.0) installed
  • make (min. 3.81) installed

Project structure

To get used to it – i prepared some files for you. You only need to change the box name/url in Vagrantfile.

$ tree
.
├── Makefile
├── requirements.txt
├── Vagrantfile
└── tests.py
ENV_DIR = .env
CURRENT_DIR := $(shell pwd)
INTERPRETER = $(CURRENT_DIR)/$(ENV_DIR)/bin/
PATH := ${PATH}:$(INTERPRETER)

help:
	@echo "run make <target> with:"
	@echo " > env       : create virtualenv directory $(ENV_DIR)"
	@echo " > deps      : install dependencies from requirements.txt"
	@echo " > clean_env : delete virtualenv directory $(ENV_DIR)"
	@echo " > up        : run vagrant up"
	@echo " > destroy   : run vagrant destroy"
	@echo " > test      : run testinfra on vagrant environment"
	@echo " > clean_all : delete all files and directories"

env:
	@echo "[RUN]: create virtualenv"
	virtualenv $(ENV_DIR) && \
	. $(ENV_DIR)/bin/activate && \
	make deps

deps:
	@echo "[RUN]: install dependencies"
	$(INTERPRETER)/pip install -r requirements.txt

up:
	@echo "[RUN]: vagrant up"
	vagrant up

destroy:
	@echo "[RUN]: vagrant destroy -f"
	vagrant destroy -f
	rm -fr $(CURRENT_DIR)/.vagrant

test:
	@echo "[RUN]: run testinfr on vagrant environment"
	vagrant ssh-config > $(CURRENT_DIR)/ssh-config
	$(INTERPRETER)/pytest -v --hosts=default --ssh-config=$(CURRENT_DIR)/ssh-config tests.py

clean_all:
	@echo "[RUN]: delete all files and directories"
	rm -fr $(CURRENT_DIR)/.cache $(CURRENT_DIR)/__pycache__
	rm -f $(CURRENT_DIR)/ssh-config
	make destroy
	make clean_env

clean_env:
	@echo "[RUN]: delete virtualenv"
	rm -fr $(ENV_DIR)
testinfra==1.5.4
paramiko==2.1.2
#!/usr/bin/env python

def test_system_type(SystemInfo):
    '''Check OS type'''
    type = SystemInfo.type
    assert type == 'linux'

def test_user_exists(User):
    '''Check user exists'''
    user = User('vagrant')
    assert user.exists

def test_firewalld_is_installed(Package):
    '''Check firewalld is installed'''
    package = Package('firewalld')
    assert package.is_installed

def test_firewalld_running_and_enabled(Service):
    '''Check firewalld service is running and enabled'''
    service = Service('firewalld')
    assert service.is_running
    assert service.is_enabled
# -*- mode: ruby -*-
# vi: set ft=ruby :

Vagrant.configure("2") do |config|

  # disable ssh key update
  config.ssh.insert_key = false

  # vagrant box name
  config.vm.box = ""

  # vagrant box url
  config.vm.box_url = ""

  # disable box update
  config.vm.box_check_update = false

  # disable synced_folder
  config.vm.synced_folder ".", "/vagrant", disabled: true

  # 2nd network interface (public)
  # config.vm.network "public_network"

  # virtualbox settings
  config.vm.provider "virtualbox" do |vb|
    vb.name = "example_vm"
    vb.cpus = "2"
    vb.memory = "2048"
    vb.gui = false
  end

end

Usage

# create virtualenv and install dependencies
$ make env

# create vagrant environment
$ make up

# run tests
$ make test

# delete all generated files and directories
$ make clean_all

Testinfra offers several connections backends for remote command execution and can be used with python standard unit test framework: unittest. So the integration with build servers is easily possible.

Tiny SSH audit

I wrote an bash script which makes the SSH server configuration audit a little bit easier. Here now an description for usage. The repository can found here.

Usage

# upload script to target host (tmp directory)
$ scp ssh_audit.sh <user>@<host>:/tmp

# login into target host
$ ssh <user>@<host>

# switch to root
$ su -

# change file permissions (optional)
$ chmod u+x /tmp/ssh_audit.sh

# run ssh audit
$ /tmp/ssh_audit.sh

The output is self-explanatory. If you need more details, just run following command.

# output the effective configuration to stdout (Extended test mode)
$ sshd -T

Build a Docker Penetration Test environment

Today we build a penetration test environment via Docker. That means no Plug-Ins (for example: Java) are needed! If you are Mac OS X users, a VNC client is already included (since Yosemite).

Preparation:

# download all needed Docker images
$ docker pull owasp/zap2docker-stable
$ docker pull citizenstig/dvwa
$ docker pull jmbmxer/threadfix

# list local Docker images
$ docker images
...
REPOSITORY                TAG                 IMAGE ID            CREATED             SIZE
owasp/zap2docker-stable   latest              a774bdc65502        3 months ago        1.557 GB
jmbmxer/threadfix         latest              b6f1907a61cd        5 months ago        941 MB
citizenstig/dvwa          latest              c8312743bc09        23 months ago       478.5 MB

ZAP Attack Proxy

# run Docker container with ZAP Attack Proxy (insert and remember password)
$ docker run -u zap -p 5900:5900 -p 8080:8080 -v /tmp/reports:/home/zap/reports --name zap -i owasp/zap2docker-stable x11vnc --forever --usepw --create

# start VNC (Mac OS X)
$ open /System/Library/CoreServices/Applications/Screen\ Sharing.app/

…or use the short way via: [cmd] + [space] and type screen sharing

vnc connection to zap

Insert “localhost” and your given password… and follow introduction for ZAP startup. Now you configure the ZAP Proxy Settings.

zap proxy configuration

Note: Select IP “0.0.0.0” for later use. You can also use “$ docker inspect zap” to find out the internal IP, but this could change on next start.

DVWA

# run Docker container with DVWA (2nd terminal)
$ docker run -d -p 8081:80 --name dvwa citizenstig/dvwa

# wait for startup
$ docker logs -f dvwa

# get host ip (from where you run browser)
$ ifconfig

Now start your Firefox browser and change proxy settings. Insert your IP!

firefox proxy settings

Call URL for DVWA in Firefox and run your penetration tests.

pentest firefox zap

When you are done, export XML report

zap xml report
From now on, you can stop all running docker container.

ThreadFix

# run Docker container with ThreadFix
$ docker run -d -p 8443:8443 --name threadfix jmbmxer/threadfix start

# wait for startup
$ docker logs -f threadfix

Open Safari and call URL: https://localhost:8443/threadfix. Login with User: “user” and Password: “password”. Create a new team and add a application to team.

# open directory in finder
$ open /tmp/reports/

Import the ZAP XML report.

threadfix zap report

That is it… enjoy and expand your pentest laboratory!

Docker Audit

This tutorial shows software testers some simple examples for Docker audit. Here now we will make some audits on Docker environment and Dockerfiles.

Docker environment audit

# check Docker environment with docker-bench-security
$ docker run -it --net host --pid host --cap-add audit_control \
    -v /var/lib:/var/lib \
    -v /var/run/docker.sock:/var/run/docker.sock \
    -v /usr/lib/systemd:/usr/lib/systemd \
    -v /etc :/etc --label docker_bench_security \
    docker/docker-bench-security

Note: 1st the space after /etc is only because of security settings from my provider! 2nd create os specific docker-bench-security (example CentOS)

Dockerfile audit

# install on RedHat, CentOS, Fedora ...
$ yum install epel-release && yum install lynis

# install on Debian, Ubuntu ...
$ apt-get install lynis

# Suse
$ zypper install lynis

# install via Homebrew
$ brew install lynis

# audit Dockerfile
$ lynis audit dockerfile Dockerfile

# check log file
$ cat /var/log/lynis.log
$ cat /var/log/lynis-report.dat

Lint Dockerfile with Haskell Dockerfile Linter

# simply run Container again Dockerfile
$ docker run --rm -i lukasmartinelli/hadolint < Dockerfile

Visualization of package dependencies

Documentation takes time – sometimes a lot of time. Here a few examples how to create dependencies pictures with Graphviz via command line. These commands can then be easily transferred to a build-process to save your time.

Mac OS X

# install Graphviz on Mac OS X
$ curl -O http://www.graphviz.org/pub/graphviz/stable/macos/mountainlion/graphviz-2.36.0.pkg
$ open graphviz-2.36.0.pkg

# check installation
$ dot -V
dot - graphviz version 2.36.0 (20140111.2315)

# clone PureDarwin
$ git clone https://github.com/PureDarwin/PureDarwin.git

# change directory
$ cd PureDarwin/scripts/

# create graph for non-installed mtr
$ sudo ./pd_portviz mtr

CentOS 7

# install Graphviz on CentOS 7
$ yum install -y graphviz

# check installation
$ dot -V
dot - graphviz version 2.30.1 (20150306.0020)

# install rpmdep
$ yum install -y epel-release && yum install -y rpmorphan

# create graph for installed which
$ rpmdep -dot which.dot which

Debian 8

# install Graphviz on Debian 8
$ apt-get install -y graphviz

# check installation
$ dot -V
dot - graphviz version 2.38.0 (20140413.2041)

# install debtree
$ apt-get install -y debtree

# create graph for non-installed make
$ debtree --with-suggests make > make.dot

Example graph for mtr on Mac OS X

# convert .dot into png
$ dot -Tpng mtr.dot -o mtr.png

mtr dependencies

Monitor running docker containers with cAdvisor

As a software tester, you have several containers run in your environment. Here is an example how easily and quickly you can monitor your test-environment with cAdvisor.

Preconditions

Preparation

# create project (local)
$ mkdir -p ~/Projects/Monitoring && cd ~/Projects/Monitoring

# create shell script (local)
$ vim start-demo.sh
#!/usr/bin/env sh

docker run -d --name cadvisor -P -v /:/rootfs:ro -v /var/run:/var/run:rw -v /sys:/sys:ro -v /var/lib/docker/:/var/lib/docker:ro google/cadvisor:latest
docker run -d --name jenkins -P jenkins
docker run -d --name selenium-hub -P selenium/hub:2.53.0
docker run -d --name selenium-node_1 --link selenium-hub:hub selenium/node-chrome:2.53.0
docker run -d --name selenium-node_2 --link selenium-hub:hub selenium/node-firefox:2.53.0

Note: You can also assign the respective ports!

Run docker containers

# create new VM (local)
$ docker-machine create -d virtualbox monitor

# show status (local)
$ docker-machine ls
...
NAME      ACTIVE   DRIVER       STATE     URL                         SWARM   DOCKER    ERRORS
monitor   -        virtualbox   Running   tcp://192.168.99.100:2376           v1.11.1  

# copy into VM (local) 
$ docker-machine scp ~/Projects/Monitoring/start-demo.sh monitor:/home/docker/

# ssh into VM (local into VM)
$ docker-machine ssh monitor

# change rights (VM)
$ chmod +x start-demo.sh && ls -la

# run shell script (VM)
$ ./start-demo.sh

# list running docker container (VM)
$ docker ps -a
...
CONTAINER ID        IMAGE                          COMMAND                  CREATED              STATUS              PORTS                                               NAMES
57c2598b4261        selenium/node-firefox:2.53.0   "/opt/bin/entry_point"   4 seconds ago        Up 4 seconds                                                            selenium-node_2
d79a5123bcfc        selenium/node-chrome:2.53.0    "/opt/bin/entry_point"   29 seconds ago       Up 29 seconds                                                           selenium-node_1
095f9844346d        selenium/hub:2.53.0            "/opt/bin/entry_point"   About a minute ago   Up About a minute   0.0.0.0:32771->4444/tcp                             selenium-hub
8db3ad58d8ce        jenkins                        "/bin/tini -- /usr/lo"   About a minute ago   Up About a minute   0.0.0.0:32770->8080/tcp, 0.0.0.0:32769->50000/tcp   jenkins
d1e1e1c36d6d        google/cadvisor:latest         "/usr/bin/cadvisor -l"   2 minutes ago        Up 2 minutes        0.0.0.0:32768->8080/tcp                             cadvisor

Open browser

cAdvisor