PHP QA Tools and Docker Jenkins

This Tutorial is about some simple PHP QA Tools and Docker Jenkins. I will show near how to install PHP and PHP Composer in an Jenkins Alpine Linux Docker inclusive some needed Jenkins PlugIns.

Note

If you have an running Docker Container already which you cannot stop, you can install needed packages directly via:

# list containers (optional)
$ docker ps -a

# access running container as root
$ docker exec -u 0 -it <Container Name> sh

# install packages and exit container
...

Now you can use the same commented commands as provided via Dockerfile. Otherwise follow next steps.

Let’s go

# create new project
$ mkdir -p ~/Projects/DockerJenkins && cd ~/Projects/DockerJenkins/

# create Dockerfile and plugins.txt
$ touch Dockerfile plugins.xt

# modify Dockerfile
$ vim Dockerfile

# modify plugins.txt
$ vim plugins.txt
FROM jenkins/jenkins:lts-alpine

USER root

RUN apk update && apk upgrade

# install needed libary packages
RUN apk --no-cache add libssh2 libpng freetype libjpeg-turbo libgcc \
libxml2 libstdc++ icu-libs libltdl libmcrypt

# install needed PHP packages
RUN apk --no-cache add php7 php7-fpm php7-opcache php7-gd php7-pdo_mysql \
php7-mysqli php7-mysqlnd php7-mysqli php7-zlib php7-curl php7-phar \
php7-iconv php7-pear php7-xml php7-pdo php7-ctype php7-mbstring \
php7-soap php7-intl php7-bcmath php7-dom php7-xmlreader php7-openssl \
php7-tokenizer php7-simplexml php7-json

# Download and install composer installer
RUN php -r "copy('https://getcomposer.org/installer', 'composer-setup.php');"
RUN php -r "if (hash_file('SHA384', 'composer-setup.php') === '544e09ee996cdf60ece3804abc52599c22b1f40f4323403c44d44fdfdd586475ca9813a858088ffbc1f233e9b180f061') { echo 'Installer verified'; } else { echo 'Installer corrupt'; unlink('composer-setup.php'); } echo PHP_EOL;"
RUN php composer-setup.php
RUN mv composer.phar /usr/local/bin/composer
RUN chmod +x /usr/local/bin/composer
RUN rm -f composer-setup.php

USER jenkins

# install plugins from plugins.txt
COPY plugins.txt /usr/share/jenkins/ref/plugins.txt
RUN /usr/local/bin/install-plugins.sh < /usr/share/jenkins/ref/plugins.txt
checkstyle:3.50
analysis-core:1.95
dry:2.50
pmd:3.50
violations:0.7.11

That was it! Now build the image, start and work with jenkins.

# build image from Dockerfile
$ docker build -t lupin/jenkins:lts-alpine .

# list images (optional)
$ docker images

# start container
$ docker run --name JenkinsPHP -p 8080:8080 lupin/jenkins:lts-alpine

Test

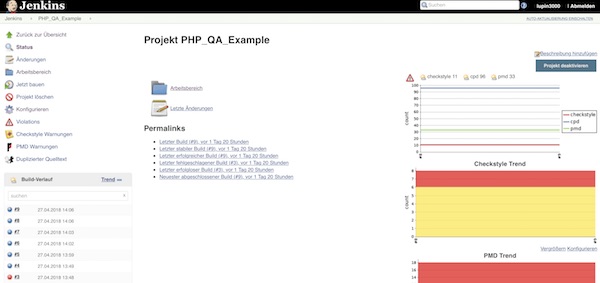
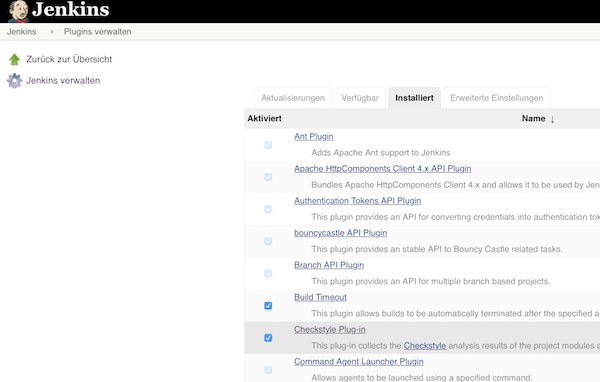
After starting, configuring and logging, you can see the already installed plugins in the Jenkins PlugIns!

Jenkins PlugIns

To test, you can create a simple freestyle job. Here you configure the repository, build steps and post-build actions. After a few runs, the results should be visible on the project side.

Jenkins Build Results

Setup learning environment for security testing

In a previous tutorial, I showed you how to set up a security learning environment quickly. Since there are some changes now (ex: Webswing), I’ll do the tutorial again. By the way i use macOS, some commands could be different but similar for Linux or Windows.

Requirements

  • Docker (17.12.0-ce)
  • Safari (11.02)
  • Firefox (58.0)

Search and download needed docker images

# search DVWA image (optional)
$ docker search dvwa

# pull DVWA image
$ docker pull citizenstig/dvwa

# search ZAP image (optional)
$ docker search zap

# pull ZAP image
$ docker pull owasp/zap2docker-stable

# search ThreadFix image (optional)
$ docker search threadfix

# pull ThreadFix image
$ docker pull jmbmxer/threadfix

# list images (optional)
$ docker images
...
REPOSITORY                 TAG       IMAGE ID        CREATED         SIZE
owasp/zap2docker-stable    latest    40848e80b7fb    2 months ago    1.33GB
jmbmxer/threadfix          latest    b6f1907a61cd    22 months ago   941MB
citizenstig/dvwa           latest    c8312743bc09    3 years ago     478MB
...

Run DVWA container

# run DVWA container
$ docker run -d -p 8081:80 --name dvwa citizenstig/dvwa

# check DVWA logs for startup (optional)
$ docker logs -f dvwa

# get local ip
$ ipconfig getifaddr en0
...
192.168.192.39
...

# start DVWA in browser
$ open -a Safari http://192.168.192.39:8081/

DVWA inside Browser

…Setup/create new database…

setup dvwa

Run ZAP container

# create folder
$ mkdir -p /tmp/reports

# run ZAP container
$ docker run -u zap -i -p 8080:8080 -p 8090:8090 -v /tmp/reports:/home/zap/reports --name zap owasp/zap2docker-stable zap-webswing.sh

# start ZAP in Browser
$ open -a Safari http://localhost:8080/?anonym=true&app=ZAP

ZAP inside browser

Please check via “Tools” -> “Options” -> “Local Proxies” the right configuration!

ZAP Proxy configuration

You need do use the non-routable meta address (0.0.0.0)!

Run ThreadFix container

# run ThreadFix container
$ docker run -d -p 8443:8443 --name threadfix jmbmxer/threadfix start

# check ThreadFix logs for startup (optional)
$ docker logs -f threadfix
...
Jan 30, 2018 8:56:40 AM org.apache.catalina.startup.Catalina start
INFO: Server startup in 49986 ms
...

# start ThreadFix in Browser
$ open -a Safari https://localhost:8443/threadfix/

Login into ThreadFix with “user/password

ThreadFix login

Create new team with application.

Configure Firefox

# get local ip
$ ipconfig getifaddr en0
...
192.168.192.39
...

# open Firefox preferences
$ /Applications/Firefox.app/Contents/MacOS/firefox --preferences

Configure manual proxy with your local IP and 2nd ZAP port (8090). Afterwards you enable checkbox “Use this proxy server for all protocols” and press OK button.

Firefox proxy configuration

When all the configurations have been made, you can temporarily quit Firefox.

Use environment

# list all containers (optional)
$ docker ps -a

# open DVWA via Proxy
$ open -a firefox http://192.168.192.39:8081

Start recording and save your XML report “Report -> Generate XML Report”.

Save ZAP XML report

# open reports directory in finder
$ open /tmp/reports

Import XML report

Next steps

Now it’s time to study! If you need help, you can found a lot of training materials on Youtube.

Create a simple video test environment (Part 3)

Okay, now is time to see some command line tools to analysis videos. I selected 4 Open-Source applications (avprobe, mediainfo, mplayer, exiftool).

Specification

  • docker
  • git

Get ready for docker images

On Bitbucket I created a repository with needed Dockerfiles for fast usage. You can also choose the installation method.

# change directory (optional)
$ cd ~/Projects/

# clone repository
$ git clone https://bitbucket.org/Lupin3000/tinydockerapps ~/Projects/tinydockerapps

# change directory
$ cd ~/Projects/VideoTest/

# build docker image for mediainfo
$ docker build -t debian/mediainfo ~/Projects/tinydockerapps/mediainfo/

# build docker image for mplayer
$ docker build -t debian/mplayer ~/Projects/tinydockerapps/mplayer/

# build docker image for exiftool
$ docker build -t debian/exiftool ~/Projects/tinydockerapps/exiftool/

# build docker image for avprobe
$ docker build -t debian/avprobe ~/Projects/tinydockerapps/avprobe/

# check available images (optional)
$ docker images

mediainfo

Lets start with mediainfo. Here some information about on wikipedia.

# list help
$ docker run --rm -i -v ~/Projects/VideoTest/:/mnt debian/mediainfo --help

# run simple scan
$ docker run --rm -i -v ~/Projects/VideoTest/:/mnt debian/mediainfo demo.mp4

# run full scan
$ docker run --rm -i -v ~/Projects/VideoTest/:/mnt debian/mediainfo -f demo.mp4

# show aspect ratio
$ docker run --rm -i -v ~/Projects/VideoTest/:/mnt debian/mediainfo --Inform="Video;%DisplayAspectRatio%" demo.mp4

# show duration
$ docker run --rm -i -v ~/Projects/VideoTest/:/mnt debian/mediainfo --Inform="General;%Duration/String3%" demo.mp4

# show audio format
$ docker run --rm -i -v ~/Projects/VideoTest/:/mnt debian/mediainfo --Inform="Audio;%Format%" demo.mp4

# show resolution and codec
$ docker run --rm -i -v ~/Projects/VideoTest/:/mnt debian/mediainfo --Inform="Video;Resolution=%Width%x%Height%\nCodec=%CodecID%" demo.mp4

# list all possible file parameters
$ docker run --rm -i -v ~/Projects/VideoTest/:/mnt debian/mediainfo --info-parameters | less

# create XML report (all internal tags)
$ docker run --rm -i -v ~/Projects/VideoTest/:/mnt debian/mediainfo -f --Output=XML demo.mp4

# show mediatrace info
$ docker run --rm -i -v ~/Projects/VideoTest/:/mnt debian/mediainfo --Details=1 demo.mp4

# create report file
$ docker run --rm -i -v ~/Projects/VideoTest/:/mnt debian/mediainfo demo.mp4 --LogFile="Report.log"

mplayer

Second application is mplayer. Here the wikipedia link.

# list help
$ docker run --rm -i -v ~/Projects/VideoTest/:/mnt debian/mplayer --help

# show all properties
$ docker run --rm -i -v ~/Projects/VideoTest/:/mnt debian/mplayer -vo null -ao null -frames 0 -identify demo.mp4

# show all video properties
$ docker run --rm -i -v ~/Projects/VideoTest/:/mnt debian/mplayer -vo null -ao null -frames 0 -identify demo.mp4 | grep VIDEO

# show all audio properties
$ docker run --rm -i -v ~/Projects/VideoTest/:/mnt debian/mplayer -vo null -ao null -frames 0 -identify demo.mp4 | grep AUDIO

# show video format
$ docker run --rm -i -v ~/Projects/VideoTest/:/mnt debian/mplayer -vo null -ao null -frames 0 -identify demo.mp4 | grep ID_VIDEO_FORMAT

exiftool

Now we take a look on exiftool. Here the wikipedia article and the official documentation.

# show all parameters
$ docker run --rm -i -v ~/Projects/VideoTest/:/mnt debian/exiftool demo.mp4

# show all parameters sort by group (including duplicate and unknown tags)
$ docker run --rm -i -v ~/Projects/VideoTest/:/mnt debian/exiftool -a -u -g1 demo.mp4

# show friendly parameters
$ docker run --rm -i -v ~/Projects/VideoTest/:/mnt debian/exiftool -s -G demo.mp4

# show Height and Width
$ docker run --rm -i -v ~/Projects/VideoTest/:/mnt debian/exiftool '-*source*image*' demo.mp4

# show audio format
$ docker run --rm -i -v ~/Projects/VideoTest/:/mnt debian/exiftool '-*Audio*Format*' demo.mp4

# show video duration
$ docker run --rm -i -v ~/Projects/VideoTest/:/mnt debian/exiftool '-*Duration*' demo.mp4 | head -1

# create json output with specific values
$ docker run --rm -i -v ~/Projects/VideoTest/:/mnt debian/exiftool -j -VideoFrameRate -MediaDuration demo.mp4 > report.json

# create csv report file with specific values
$ docker run --rm -i -v ~/Projects/VideoTest/:/mnt debian/exiftool -csv -FileSize -ImageWidth -ImageHeight -AudioFormat -AudioChannels demo.mp4 > report.csv

avprobe

Last but not least avprobe. Here the wikipedia article and detailed official documentation.

# list help
$ docker run --rm -i -v ~/Projects/VideoTest/:/mnt debian/avprobe --help

# list available formats
$ docker run --rm -i -v ~/Projects/VideoTest/:/mnt debian/avprobe -formats

# list available codecs
$ docker run --rm -i -v ~/Projects/VideoTest/:/mnt debian/avprobe -codecs

# show all properties
$ docker run --rm -i -v ~/Projects/VideoTest/:/mnt debian/avprobe demo.mp4

# show stream properties in json format
$ docker run --rm -i -v ~/Projects/VideoTest/:/mnt debian/avprobe -of json -loglevel quiet -show_streams demo.mp4

# show specific properties
$ docker run --rm -i -v ~/Projects/VideoTest/:/mnt debian/avprobe -show_format -show_streams -pretty demo.mp4

# show size properties
$ docker run --rm -i -v ~/Projects/VideoTest/:/mnt debian/avprobe -show_entries format=size demo.mp4

# show duration and size properties
$ docker run --rm -i -v ~/Projects/VideoTest/:/mnt debian/avprobe -loglevel quiet -show_entries format=duration,size demo.mp4

# show duration and size properties in json format
$ docker run --rm -i -v ~/Projects/VideoTest/:/mnt debian/avprobe -of json -loglevel quiet -show_entries format=duration,size demo.mp4

Compare tools by expecting specific result

I will not judge the applications against each other! But here a compare of complexity of commands and output for video duration.

# get duration by exiftool
$ exiftool -s -s -s  -MediaDuration demo.mp4
...
0:01:04

# get duration by mediainfo
$ mediainfo --Inform="General;%Duration/String3%" demo.mp4
...
00:01:04.884

# get duration by avprobe
$ avprobe -v error -sexagesimal -show_entries format=duration -of default=noprint_wrappers=1:nokey=1 demo.mp4
...
0:01:04.884000

# get duration by mplayer
$ mplayer -vo null -ao null -frames 0 -nolirc -identify demo.mp4 | grep ID_LENGTH | cut -d'=' -f2
...
64.88

Create a simple video test environment (Part 2)

In the first part we created the video test environment and you learned how to extend it. At the end of this tutorial you will know how to embed video content in the video test environment. Therefore, a few basics are shown around ffmpeg (how to create, edit and use videos).

Record and prepare some videos

The recording should contain video and sound and should be 5 minutes long. The content of the video does not matter!

# open Quicktime Player
$ open -a "QuickTime Player"

# press Control-Command-N, start record (approximately 5 min)
# save record into project folder as movie.mov (~/Projects/VideoTest/movie.mov)

As soon as a video is ready we have to create more.

# copy binary (optional)
$ sudo cp ~/Projects/VideoTest/ffmpeg /usr/local/bin/ffmpeg && sudo chmod a+rx /usr/local/bin/ffmpeg

# convert mov into mp4 (copy)
$ ffmpeg -i movie.mov -vcodec copy -acodec copy demo.mp4

# resize mp4 to 320x240 (filter_graph)
$ ffmpeg -i demo.mp4 -vf scale=320:240 ./src/demo_scaled.mp4

# create poster from mp4 (position and frame)
$ ffmpeg -i ./src/demo_scaled.mp4 -ss 00:00:30 -vframes 1 ./src/demo_poster.png

# create m3u8/ts files from mp4 (HLS - Apple HTTP Live Stream)
$ ffmpeg -i demo.mp4 -b:v 1M -g 60 -hls_time 2 -hls_list_size 0 -hls_segment_size 500000 ./src/output.m3u8

# run specific SHELL provisioner
$ vagrant provision --provision-with video

Note: After this step you will have many video files which you will use

  • ./movie.mov (original)
  • ./demo.mp4 (converted)
  • ./src/demo_scaled.mp4 (converted and resized)
  • ./src/output.m3u8
  • ./src/\*.ts

Get in contact with ffmpeg

I assume that ffmpeg is properly installed and the test environment is running.

# create target folder
$ mkdir ~/Projects/VideoTest/test

# extract some images from video
$ ffmpeg -i movie.mov -ss 00:00:30 -t 0.1 -f image2 -qscale 2 -vcodec mjpeg ./test/img-%03d.jpg

# create local m3u8/ts files from mp4
$ ffmpeg -i demo.mp4 -b:v 1M -g 60 -hls_time 2 -hls_list_size 0 -hls_segment_size 500000 ./test/output.m3u8

# extract mp4 from local m3u8/ts files
$ ffmpeg -i test/output.m3u8 -bsf:a aac_adtstoasc -vcodec copy -c copy -crf 50 ./test/output_local.mp4

# extract mp4 from url to m3u8 file (will not work with LiveStream)
$ ffmpeg -i http://localhost:8080/output.m3u8 -c copy -bsf:a aac_adtstoasc stream.mp4

Stream videos

# open browser
$ open -a Safari http://localhost:8080/livestream.html

# stream video (Real-Time Messaging Protocol)
$ ffmpeg -re -i demo.mp4 -vcodec libx264 -vprofile baseline -g 30 -acodec aac -strict -2 -f flv rtmp://localhost/show/stream

Stream from FaceTime HD Camera (macOS)

# open browser
$ open -a Safari http://localhost:8080/livestream.html

# list devices
$ ffmpeg -f avfoundation -list_devices true -i ""

# stream sound and video (Real-Time Messaging Protocol)
$ ffmpeg -f avfoundation -framerate 30 -i "0:0" -pix_fmt yuv420p -vcodec libx264 -vprofile baseline -g 30 -acodec libmp3lame -f flv rtmp://localhost/show/stream

Create a simple video test environment

In this series I would like to clarify the following questions. How can you test local videos and videos provided by a server? What tools are there? How could the test environment look like? … So these tutorials should provide an entry into the subject of video testing. In this part, we will provide the test environment.

Specification

additional Software

Files

# create project
$ mkdir -p ~/Projects/ && cd ~/Projects/

# clone all files from repository
$ git clone https://github.com/Lupin3000/VideoTest.git

# change directory
$ cd ~/Projects/VideoTest

Project Structure

$ tree .
├── src
│   ├── directstream.html
│   ├── index.html
│   ├── livestream.html
│   ├── nginx.conf
│   └── simplevideo.html
└── Vagrantfile

Prepare and run your test environment

The test environment will created by Vagrant. The Vagrant Base box needs to be provided with Debian 9. Therefore you have now 2 options. You can use a Debian 9 Base box from Vagrant cloud or you create your own. To create your own Debian 9 Base box you can use my Packer Git repository.

Please ensure, that the  Vagrantfile is properly configured (config.vm.box_url, config.vm.box) before start-up environment.

# modify Vagrantfile (box name)
$ vim Vagrantfile

# start new environment
$ vagrant up --provision-with install,prepare,start

# open in browser
$ open -a Safari http://localhost:8080/

After successful start you will find some informations on start page about How-to create, modify, upload and stream videos. In second tutorial we will have a detailed look on it.

StartPage Video Test Environment

To understand the background somewhat better, take a look!

# tail nginx log files (optional)
$ vagrant ssh -c 'sudo tail -f /usr/local/nginx/logs/*.log'

# show content of directory (optional)
$ vagrant ssh -c 'sudo ls -la /tmp/hls/'

Develop some more

There are even more ways to publish video files (Media Streaming Server). You can easily expand the environment. Just customize/create the configurations and files in the “src” folder as well as the Vagrantfile. For Dynamic Adaptive Streaming over HTTP (DASH) support take a look here. This link opens the commercial software solution.

Note: You simply link the IDE with the “src” folder. To change the images and videos, just run vagant provisioner.

# run specific SHELL provisioner (video)
$ vagrant provision --provision-with video

# restart after configuration
$ vagrant up --provision-with stop,prepare,start

Download and install ffmpeg binaries on macOS

Currently official ffmpeg packages are available for Windows, Linux (Debian, Ubuntu, Fedora, RedHat) and macOS. You can download latest versions here.

Here now a solution for macOS users, if you don’t like to install many additional software on your system (static FFmpeg binaries).

# download ffmpeg
$ curl -C - -k https://evermeet.cx/ffmpeg/ffmpeg-3.3.3.7z -o ~/Downloads/ffmpeg-3.3.3.7z

# install debian package
$ vagrant ssh -c 'sudo apt install -y p7zip-full'

# copy archive (into shared folder)
$ cp ~/Downloads/ffmpeg-3.3.3.7z ~/Projects/VideoTest/src/

# unzip archive
$ vagrant ssh -c '7z x /home/vagrant/src/ffmpeg-3.3.3.7z'

# mv binary into src
$ vagrant ssh -c 'mv /home/vagrant/ffmpeg /home/vagrant/src/ffmpeg'

# delete archive (on shared folder)
$ rm ~/Projects/VideoTest/src/ffmpeg-3.3.3.7z

# mv binary into project folder (from shared folder)
$ mv ~/Projects/VideoTest/src/ffmpeg ~/Projects/VideoTest/

# ensure binary is executable
$ chmod +x ffmpeg

Now some basic ffmpeg commands, which should work now. If you like,you can move the binary into directory “/usr/local/”.

# show version
$ ~/Projects/VideoTest/ffmpeg -version

# show help
$ ~/Projects/VideoTest/ffmpeg -help

# list codecs
$ ~/Projects/VideoTest/ffmpeg -codecs

# list formats
$ ~/Projects/VideoTest/ffmpeg -formats

Okay, that’s it for first tutorial.

Docker, Telegraf, InfluxDB and Grafana

I have already presented various tutorials on docker monitoring. This time we will use Telegraf.

Project preparation

# create new project
$ mkdir -p Projects/DTIG/influxdb && cd Projects/DTIG/

# create telegraf.conf
$ touch telegraf.conf

InfluxDB preparation

# start InfluxDB
$ docker run --name influxdb -p 8086:8086 -v $PWD/influxdb:/var/lib/influxdb influxdb

# create new user
$ curl -G http://localhost:8086/query --data-urlencode "q=CREATE USER telegraf WITH PASSWORD 'password123' WITH ALL PRIVILEGES"

# create database for telegraf
$ curl -G http://localhost:8086/query -u telegraf:password123 --data-urlencode "q=CREATE DATABASE telegraf_db"

# show ip of influxdb container
$ docker inspect --format '{{ .NetworkSettings.IPAddress }}' influxdb
...
172.17.0.2
...

Telegraf preparation

# Telegraf Configuration

[agent]
  interval = "10s"
  round_interval = true
  metric_batch_size = 1000
  metric_buffer_limit = 10000
  collection_jitter = "0s"
  flush_interval = "10s"
  flush_jitter = "0s"
  precision = ""
  debug = false
  quiet = false
  logfile = ""
  hostname = ""
  omit_hostname = false

[[outputs.influxdb]]
  urls = ["http://172.17.0.2:8086"] # required
  database = "telegraf_db" # required
  retention_policy = ""
  write_consistency = "any"
  timeout = "5s"

[[inputs.cpu]]
  percpu = true
  totalcpu = true
  collect_cpu_time = false

[[inputs.disk]]
  ignore_fs = ["tmpfs", "devtmpfs", "devfs"]

[[inputs.docker]]
  endpoint = "unix:///var/run/docker.sock"
  container_names = []
  timeout = "5s"
  perdevice = true
  total = false
  # docker_label_include = []
  # docker_label_exclude = []

… Read more about Telegraf on documentation page …

# edit telegraf.conf
$ vim telegraf.conf

# start Telegraf
$ docker run --name telegraf -v $PWD/telegraf.conf:/etc /telegraf/telegraf.conf -v /var/run/docker.sock:/var/run/docker.sock telegraf

Note: The space after /etc is just because of security settings of my provider.

… after short time …

# show measurements (be patient)
$ curl -G http://localhost:8086/query -u telegraf:password123 --data-urlencode "db=telegraf_db" --data-urlencode "q=SHOW MEASUREMENTS"

Grafana preparation

# run grafana container
$ docker run --name grafana -i -p 3000:3000 grafana/grafana

# open Grafana WebUI and login (admin:admin)
$ open -a Safari http://localhost:3000

After login (admin:admin) you can add new Data Source.

Grafana InfluxDB Telegraf DataSource

Okay … all done … you can start to create Dashboards or search for existing Dashboards for import.

Penetration testing report via Serpico

Penetration testing make fun but writing penetration testing reports is boring. When you start you will look for templates or software which supports you. Here comes Serpico into the game. Serpico is a collaboration and report generation tool. The best… it is open-source.

Usage via Docker

# search for Serpico (optional)
$ docker search serpico

# download official image
$ docker pull serpicoproject/serpico

# create and run container
$ docker run --name serpico -p 8888:443 -it serpicoproject/serpico /bin/bash -l

# run setup script (only 1st time)
$ ruby scripts/first_time.rb

# create new user
$ ruby scripts/create_user.rb admin test123 1

# start serpico
$ ruby serpico.rb

Now you can use Serpico in your favorite browser…

# macOS use Safari
$ open -a Safari https://localhost:8888

Login with created credentials (admin/test123) and create your reports. On Youtube is a good introduction. If you don’t have Microsoft Words installed, you can view your reports online.

Docker, cAdvisor, InfluxDB and Grafana

In previous tutorials I showed the basics for docker monitoring with Prometheus and Jenkins. Here are now the basics with cAdvisor. Many steps are similar and can be implemented just as quickly.

Preparation

# create project
$ mkdir -p Projects/DCIG/influxdb && cd Projects/DCIG/

InfluxDB preparation

This time we start with InfluxDB, because cAdvisor needs it for connection!

# start InfluxDB
$ docker run --name influxdb -p 8086:8086 -v $PWD/influxdb:/var/lib/influxdb influxdb

# create new user
$ curl -G http://localhost:8086/query --data-urlencode "q=CREATE USER cadvisor WITH PASSWORD 'password123' WITH ALL PRIVILEGES"

# create database for cadvisor
$ curl -G http://localhost:8086/query -u cadvisor:password123 --data-urlencode "q=CREATE DATABASE cadvisor_db"

# show ip of influxdb container
$ docker inspect --format '{{ .NetworkSettings.IPAddress }}' influxdb
...
172.17.0.2
...

cAdvisor preparation

Now we will use User, Password and Database name. You can find the documentation here.

# start cAdvisor
$ docker run -d --name=cadvisor -v /:/rootfs:ro -v /var/run:/var/run:rw -v /sys:/sys:ro -v /var/lib/docker/:/var/lib/docker:ro -p 8080:8080 google/cadvisor:latest -storage_driver=influxdb -storage_driver_db=cadvisor_db -storage_driver_user=cadvisor -storage_driver_password=password123 -storage_driver_host=172.17.0.2:8086

# check cAdvisor logs (optional)
$ docker logs -f cadvisor

# open cAdvisor WebUI
$ open -a Safari http://localhost:8080

After a while we can also see if cAdvisor sends metrics to InfluxDB.

# show measurements (be patient)
$ curl -G http://localhost:8086/query -u cadvisor:password123 --data-urlencode "db=cadvisor_db" --data-urlencode "q=SHOW MEASUREMENTS"

prepare and run Grafana

# run grafana container
$ docker run --name grafana -i -p 3000:3000 grafana/grafana

# open Grafana WebUI and login (admin:admin)
$ open -a Safari http://localhost:3000

After login (admin:admin) configure new DataSource for InfluxDB.

DataSource InfluxDB

When DataSource is configured we import the Grafana Dashboard. (ID: 1367)

Dashboard Search cAdvisor

… be patient (don’t press any button) …

Import cAdvisor Dashboard

Select already created DataSource (InfluxDB) and press “Import” button. Now you should see the Grafana Dashboard.