There is a very easy way to pimp the Kubernetes WebUI with monitoring output. The whole thing we now realize super fast via Heapster, InfluxDB and Grafana.
Conditions
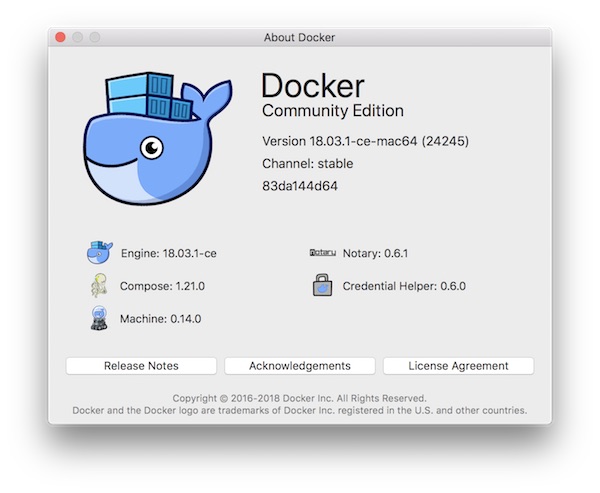
- Installed and running Docker for Mac (edge)
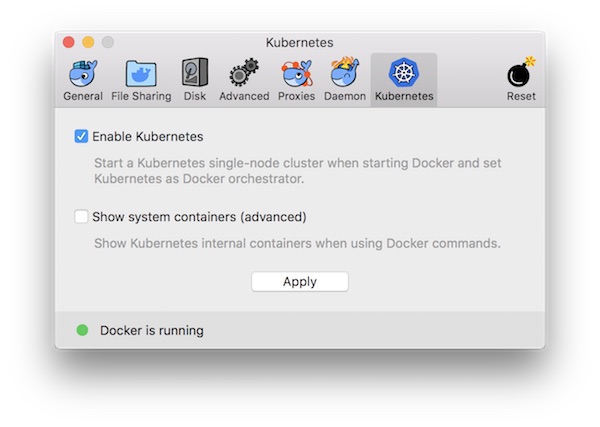
- Kubernetes enabled
Preparation
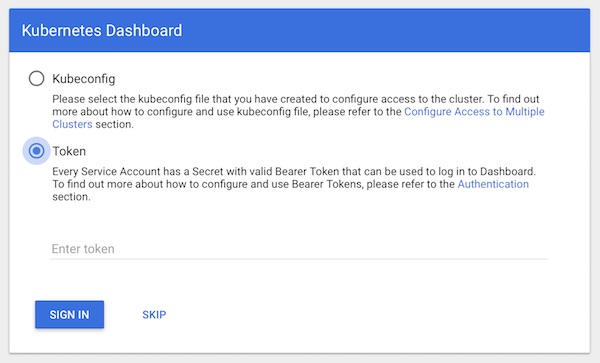
# list all pods
$ kubectl get pods --all-namespaces
...
NAMESPACE     NAME                                         READY     STATUS    RESTARTS   AGE
kube-system   kubernetes-dashboard-5bd6f767c7-f9w4j        1/1       Running   1          17d
...

# create port forward
$ kubectl port-forward kubernetes-dashboard-5bd6f767c7-f9w4j 8443:8443 --namespace=kube-system

# open WebUI in browser
$ open https://localhost:8443

# get token
$ kubectl -n kube-system get secret | grep deployment-controller-token
...
deployment-controller-token-s4xdg                kubernetes.io/service-account-token   3         17d
...

# show token
$ kubectl -n kube-system describe secret deployment-controller-token-s4xdg
...
token: XXXX
...
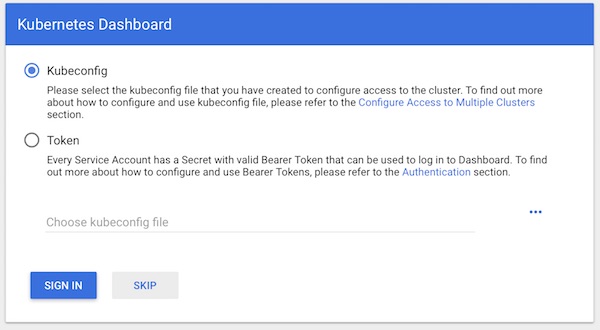
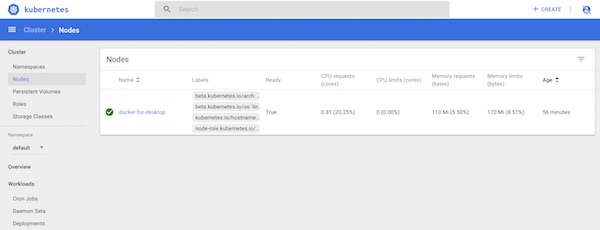
Now login to the WebUI with the token.
Enable Monitoring
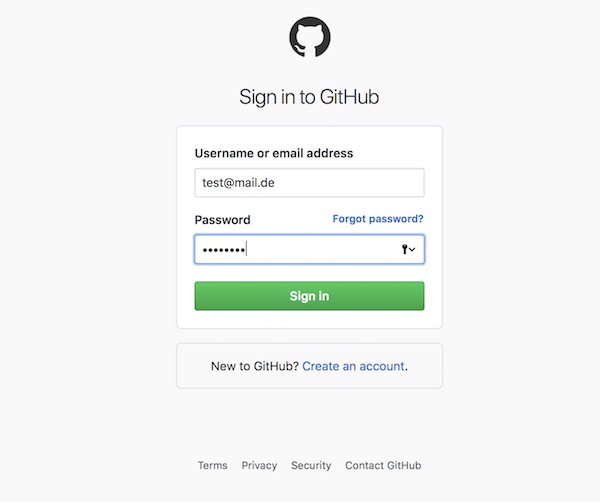
Download all 3 files from GitHub kubernetes/Heapster into your project. After download we need to modify a little bit and create deployment + service.
# edit heapster.yml
$ vim heapster.yml

# edit grafana.yml
$ vim grafana.yml

# edit influxdb.yml
$ vim influxdb.yml
Attention: The respective sections Services have to be adapted!
… But leave the rest of the content as is.
...
---
apiVersion: v1
kind: Service
metadata:
  labels:
    task: monitoring
    kubernetes.io/name: Heapster
  name: heapster
  namespace: kube-system
spec:
  ports:
  - port: 80
    targetPort: 8082
  selector:
    k8s-app: heapster
...
---
apiVersion: v1
kind: Service
metadata:
  labels:
    task: monitoring
    kubernetes.io/name: monitoring-influxdb
  name: monitoring-influxdb
  namespace: kube-system
spec:
  ports:
  - port: 8086
    targetPort: 8086
  selector:
    k8s-app: influxdb
...
---
apiVersion: v1
kind: Service
metadata:
  labels:
    kubernetes.io/name: monitoring-grafana
  name: monitoring-grafana
  namespace: kube-system
spec:
  type: NodePort
  ports:
  - port: 80
    targetPort: 3000
  selector:
    k8s-app: grafana
# create resources from files $ kubectl create -f heapster.yml $ kubectl create -f influxdb.yml $ kubectl create -f grafana.yml
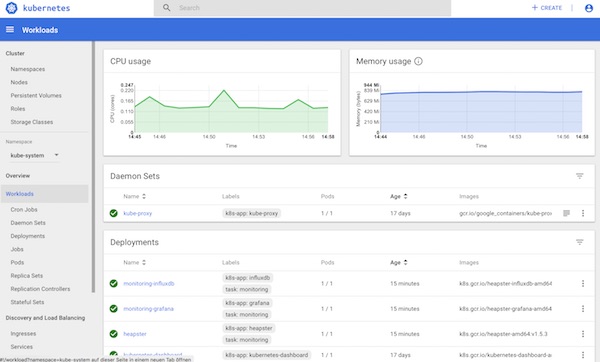
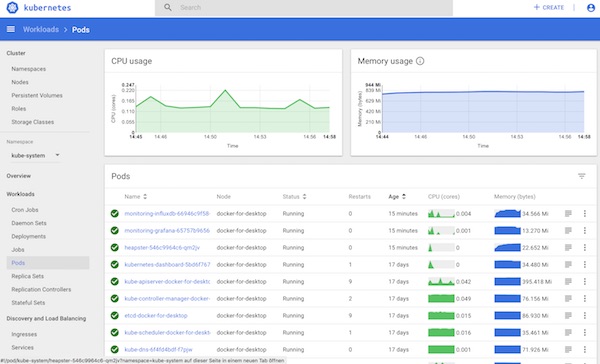
That’s it already – our monitoring is enabled! Let’s take a look at everything.
# list all services (optional)
$ kubectl get services --all-namespaces

# show details of monitoring-grafana (NodePort)
$ kubectl describe services monitoring-grafana --namespace kube-system

# open Grafana in browser
$ open http://localhost:30703
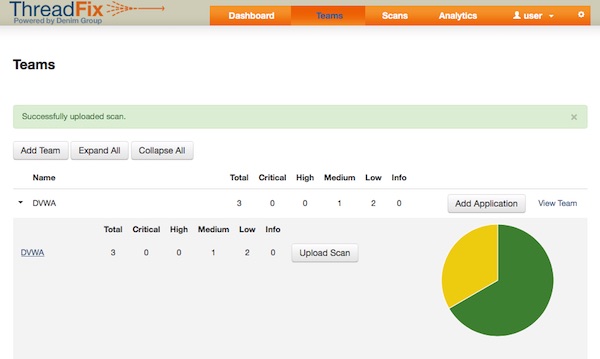
Grafana Dashboards
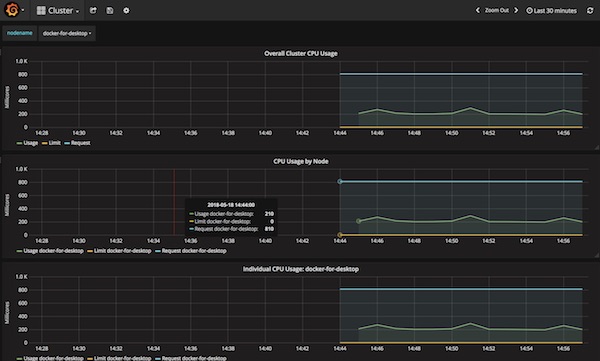
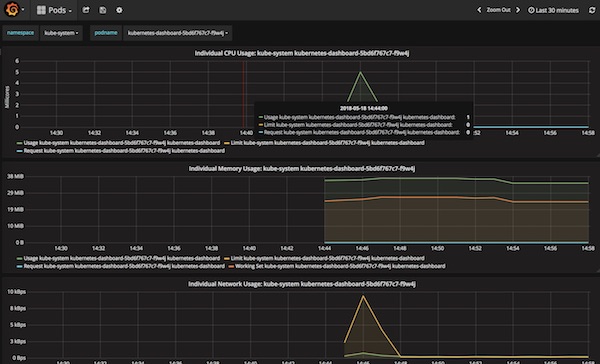
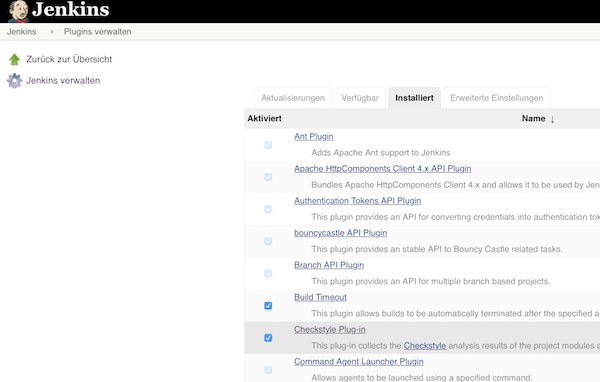
WebUI Dashboards
After a while it should look like this.