Penetration testing make fun but writing penetration testing reports is boring. When you start you will look for templates or software which supports you. Here comes Serpico into the game. Serpico is a collaboration and report generation tool. The best… it is open-source.
Usage via Docker
# search for Serpico (optional)
$ docker search serpico

# download official image
$ docker pull serpicoproject/serpico

# create and run container
$ docker run --name serpico -p 8888:443 -it serpicoproject/serpico /bin/bash -l

# run setup script (only 1st time)
$ ruby scripts/first_time.rb

# create new user
$ ruby scripts/create_user.rb admin test123 1

# start serpico
$ ruby serpico.rb
Now you can use Serpico in your favorite browser…
# macOS use Safari
$ open -a Safari https://localhost:8888
Login with created credentials (admin/test123) and create your reports. On Youtube is a good introduction. If you don’t have Microsoft Words installed, you can view your reports online.
In previous tutorials I showed the basics for docker monitoring with Prometheus and Jenkins. Here are now the basics with cAdvisor. Many steps are similar and can be implemented just as quickly.
Preparation
# create project
$ mkdir -p Projects/DCIG/influxdb && cd Projects/DCIG/
InfluxDB preparation
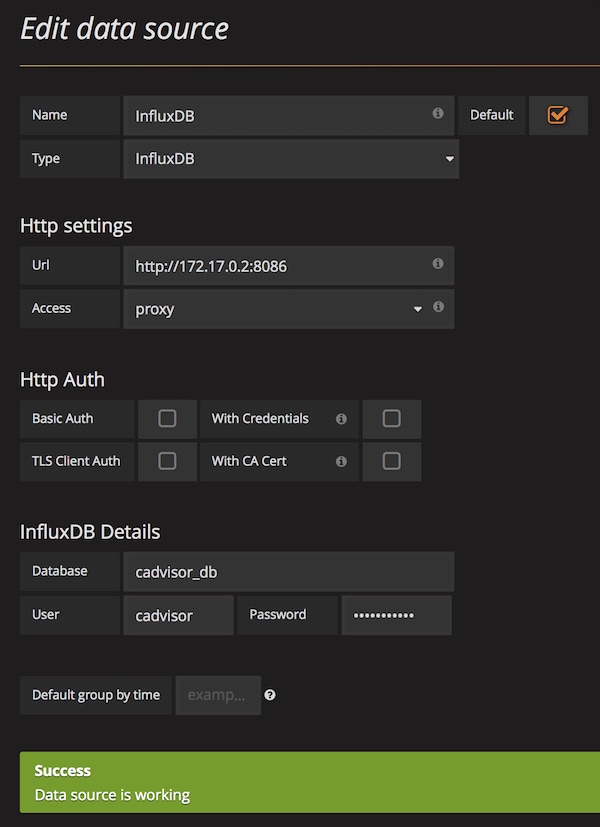
This time we start with InfluxDB, because cAdvisor needs it for connection!
# start InfluxDB
$ docker run --name influxdb -p 8086:8086 -v $PWD/influxdb:/var/lib/influxdb influxdb

# create new user
$ curl -G http://localhost:8086/query --data-urlencode "q=CREATE USER cadvisor WITH PASSWORD 'password123' WITH ALL PRIVILEGES"

# create database for cadvisor
$ curl -G http://localhost:8086/query -u cadvisor:password123 --data-urlencode "q=CREATE DATABASE cadvisor_db"

# show ip of influxdb container
$ docker inspect --format '{{ .NetworkSettings.IPAddress }}' influxdb
...
172.17.0.2
...
cAdvisor preparation
Now we will use User, Password and Database name. You can find the documentation here.
# run grafana container
$ docker run --name grafana -i -p 3000:3000 grafana/grafana

# open Grafana WebUI and login (admin:admin)
$ open -a Safari http://localhost:3000
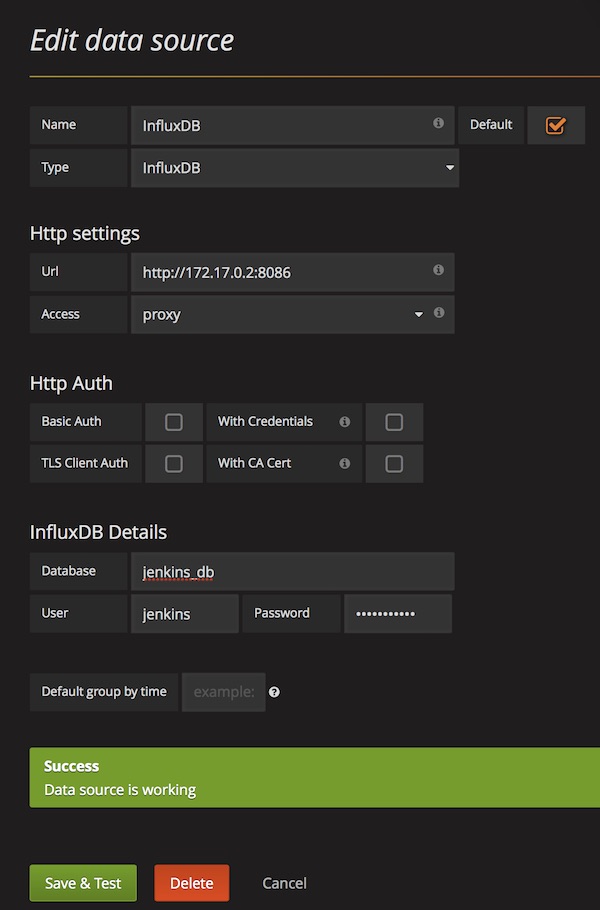
After login (admin:admin) configure new DataSource for InfluxDB.
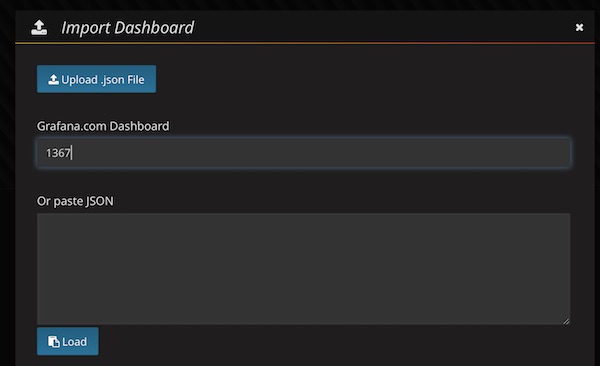
When DataSource is configured we import the Grafana Dashboard. (ID: 1367)
… be patient (don’t press any button) …
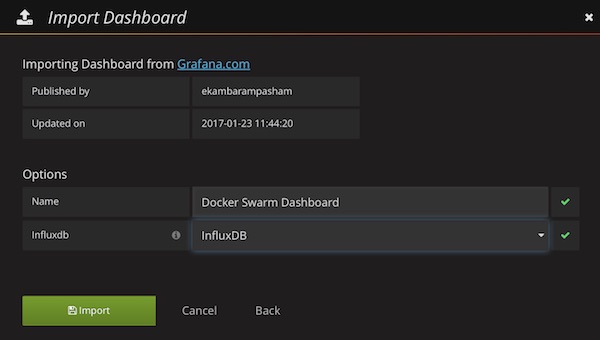
Select already created DataSource (InfluxDB) and press “Import” button. Now you should see the Grafana Dashboard.
I like Grafana … the dashboards are just cool! Here (again) a tutorial about docker monitoring. In less minutes you should be done. As a comment … for Linux and Windows you can do that too! There are only partial changes.
Prepare Project
# create project
$ mkdir -p ~/Projects/DPG && cd ~/Projects/DPG

# show current IP
$ ifconfig | grep "inet " | grep -v 127.0.0.1

# create and edit prometheus.yml
$ vim prometheus.yml
Replace <yourLocalIP> with your IP. On Docker website you can find templates for Linux and Windows, too!
# my global config
global:
  scrape_interval:     15s # Set the scrape interval to every 15 seconds. Default is every 1 minute.
  evaluation_interval: 15s # Evaluate rules every 15 seconds. The default is every 1 minute.
  # scrape_timeout is set to the global default (10s).

  # Attach these labels to any time series or alerts when communicating with
  # external systems (federation, remote storage, Alertmanager).
  external_labels:
      monitor: 'codelab-monitor'

# Load rules once and periodically evaluate them according to the global 'evaluation_interval'.
rule_files:
  # - "first.rules"
  # - "second.rules"

# A scrape configuration containing exactly one endpoint to scrape:
# Here it's Prometheus itself.
scrape_configs:
  # The job name is added as a label `job=<job_name>` to any timeseries scraped from this config.
  - job_name: 'prometheus'

    # metrics_path defaults to '/metrics'
    # scheme defaults to 'http'.

    static_configs:
      - targets: ['localhost:9090']

  - job_name: 'docker'
         # metrics_path defaults to '/metrics'
         # scheme defaults to 'http'.

    static_configs:
      - targets: ['<yourLocalIP>:9323']
Configure Docker
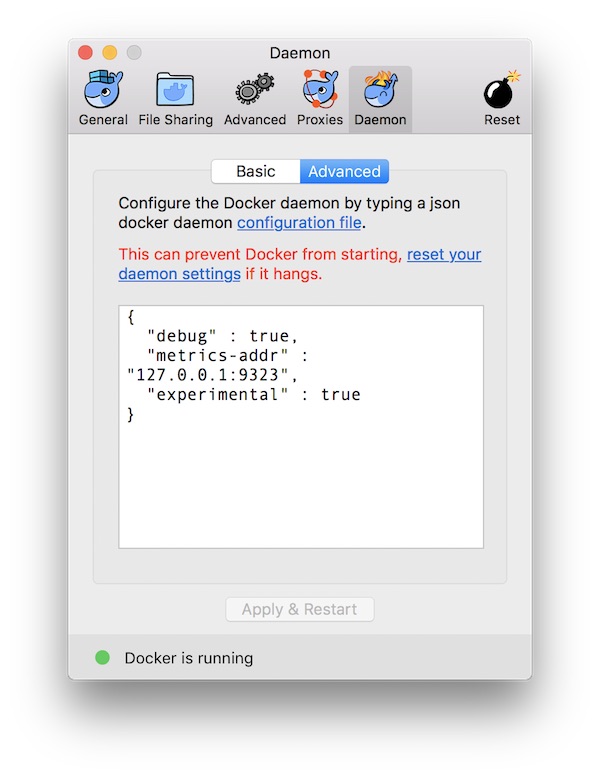
This step is very easy. Just open Docker “Preferences” and specify in section “Daemon” -> “Advanced” the metrics-address. Just ensure that you use valid JSON!
When you are done, press “Apply and Restart” button.
# view Docker metrics in browser
$ open -a Safari http://127.0.0.1:9323/metrics
Prepare Prometheus
# run Prometheus
$ docker run --name prometheus -p 9090:9090 -v $PWD/prometheus.yml:/etc /prometheus/prometheus.yml prom/prometheus
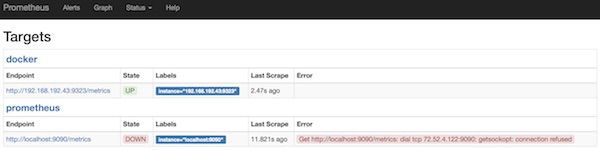
# open Prometheus WebUI
$ open -a Safari http://localhost:9090/targets
# get Prometheus IP
$ docker inspect --format '{{ .NetworkSettings.IPAddress }}' prometheus
Note: The space after /etc is just because of security settings of my provider! Please remove the space.
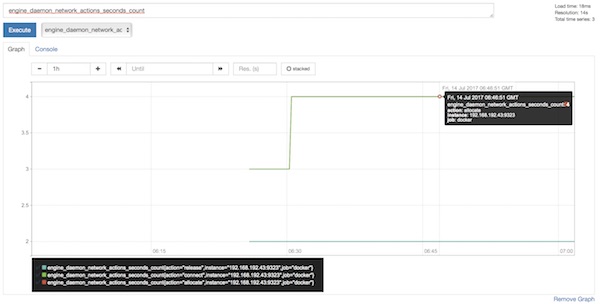
Just for fun you can create already some graphs in Prometheus.
Prepare and run Grafana
# run Grafana
$ docker run --name grafana -i -p 3000:3000 grafana/grafana

# open Grafana WebUI and login (admin:admin)
$ open -a Safari http://localhost:3000
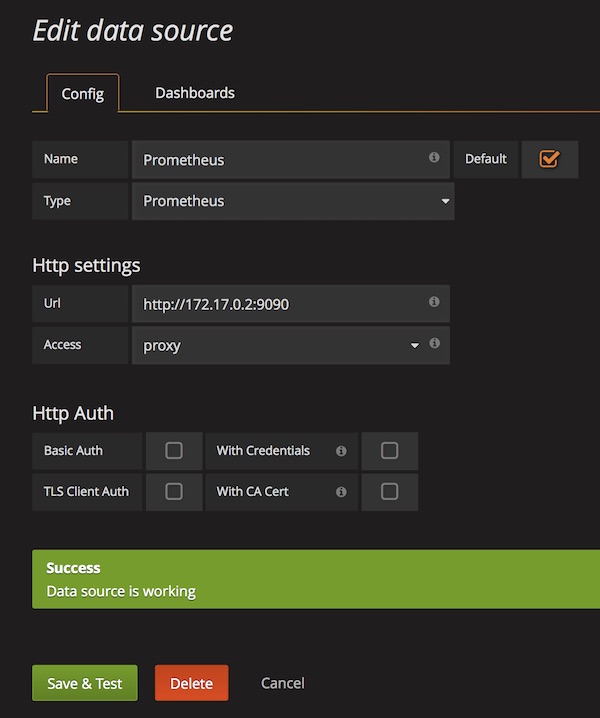
After login (admin:admin) configure new DataSource for Prometheus.
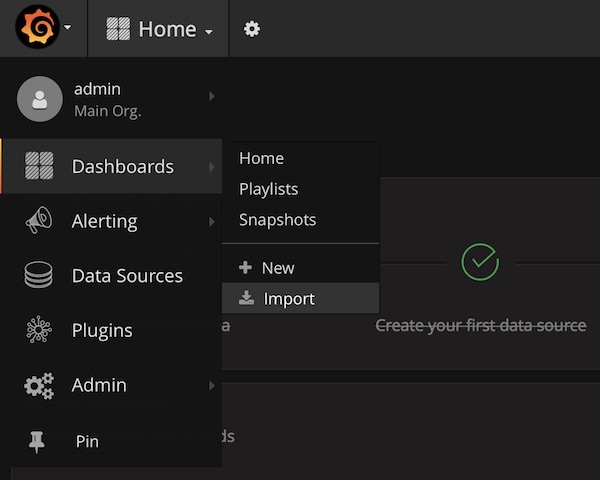
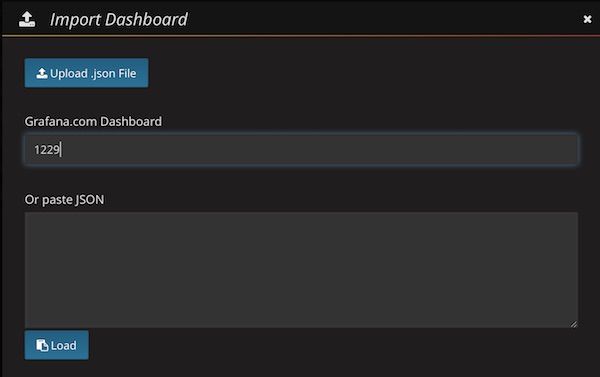
Import Dashboard (ID: 1229)
… enter ID 1229 …
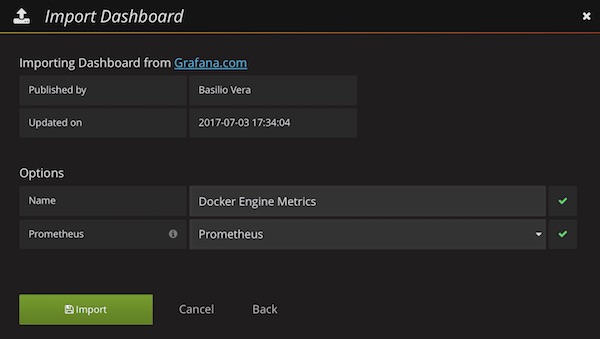
… be patient (don’t press any button) …
Select already created DataSource (Prometheus) and press “Import” button. Now you should see the awesome Grafana Dashboard.
I know there are already a lot of tutorials for this topic, but partly incomplete or no longer up to date. That’s why I’m trying now, since software testers create very often screenshots. 😉
via Preview.app
The first possibility is the Preview.app … here you can easily select with the mouse what you want to do.
via Keyboard
The next possibility are shortcuts. Here you don’t need to start Preview.app!
Capture the entire screen
[Shift] + [Command] + [3]
Capture via specific selection
[Shift] + [Command] + [4]
Capture window/menu
[Shift] + [Command] + [4]
here you can press [Space] to toggle
Capture the current Touch Bar
[Shift] + [Command] + [6]
For save to clipboard press [Control] on all actions.
via Terminal
# show man-pages
$ man screencapture

# show help
$ screencapture -h

# simple jpg
$ screencapture test.jpg

# specify file type (PNG, PDF, JPG, GIF, TIFF, BMP, PSD, PCT, etc.)
$ screencapture -t tiff test.tiff

# send to the clipboard (no name)
$ screencapture -c

# use timer (10 seconds)
$ screencapture -T 10 test.jpg
Note: please see man-pages – here you find more options!
ScreenShot Settings
# change your file format
$ defaults write com.apple.screencapture type jpg

# disable shadows
$ defaults write com.apple.screencapture disable-shadow -bool true
$ killall SystemUIServer

# enable shadows
$ defaults write com.apple.screencapture disable-shadow -bool false
$ killall SystemUIServer

# set default name
$ defaults write com.apple.screencapture name "ScreenShotName"
$ killall SystemUIServer

# set no default name
$ defaults write com.apple.screencapture name ""
$ killall SystemUIServer

# default location
$ defaults write com.apple.screencapture location ~/Pictures/
$ killall SystemUIServer

# revert default location
$ defaults write com.apple.screencapture location ~/Desktop/
$ killall SystemUIServer
Today an basic introduction to Jenkins, InfluxDB and Grafana. Docker is used to save some time. Okay,… let’s start.
Preparation
# create project and change directory
$ mkdir ~/Projects/JIG/influxdb && cd ~/Projects/JIG/

# download official jenkins image (latest)
$ docker pull jenkins

# download official influxdb image (latest)
$ docker pull influxdb

# download official grafana image (latest)
$ docker pull grafana/grafana

# list docker images
$ docker images
...
REPOSITORY          TAG                 IMAGE ID            CREATED             SIZE
jenkins             latest              59b08e8f6e37        4 days ago          704 MB
grafana/grafana     latest              2cdb407c0fa4        7 days ago          286 MB
influxdb            latest              fad81160f2de        13 days ago         224 MB
...
Jenkins preparation
# start Jenkins
$ docker run --name jenkins -p 8080:8080 jenkins
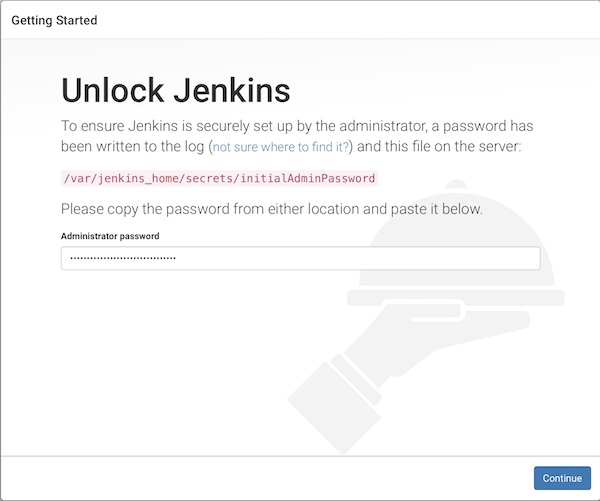
# copy password from cli
...
*************************************************************
Jenkins initial setup is required. An admin user has been created and a password generated.
Please use the following password to proceed to installation:
b49ffa5749724d61b43d3a159b181133
...
Now open your favorite browser with URL http://localhost:8080 and unlook Jenkins with following steps.
unlook with password from cli
install suggested plugins
create your admin user
start using jenkins
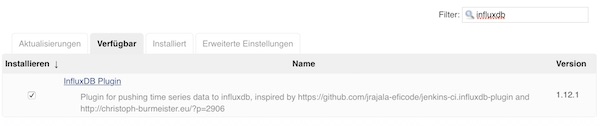
Next, the InfluxDB plug-in must be installed.
InfluxDB preparation
# start InfluxDB
$ docker run --name influxdb -p 8086:8086 -v $PWD/influxdb:/var/lib/influxdb influxdb

# check current configuration (optional)
$ docker exec -i influxdb influxd config

# create new user
$ curl -G http://localhost:8086/query --data-urlencode "q=CREATE USER jenkins WITH PASSWORD 'password123' WITH ALL PRIVILEGES"

# create database for jenkins
$ curl -G http://localhost:8086/query -u jenkins:password123 --data-urlencode "q=CREATE DATABASE jenkins_db"

# show users (optional)
$ curl -G http://localhost:8086/query -u jenkins:password123 --data-urlencode "q=SHOW USERS"
...
{"results":[{"statement_id":0,"series":[{"columns":["user","admin"],"values":[["jenkins",true]]}]}]}
...

# show databases (optional)
$ curl -G http://localhost:8086/query -u jenkins:password123 --data-urlencode "q=SHOW DATABASES"
...
{"results":[{"statement_id":0,"series":[{"name":"databases","columns":["name"],"values":[["_internal"],["jenkins_db"]]}]}]}
...

# show measurements
$ curl -G http://localhost:8086/query -u jenkins:password123 --data-urlencode "db=jenkins_db" --data-urlencode "q=SHOW MEASUREMENTS"
...
{"results":[{"statement_id":0}]}
...
Connect Jenkins with InfluxDB
# start jenkins container (if stopped)
$ docker start jenkins

# show ip of influxdb container
$ docker inspect --format '{{ .NetworkSettings.IPAddress }}' influxdb
...
172.17.0.2
...
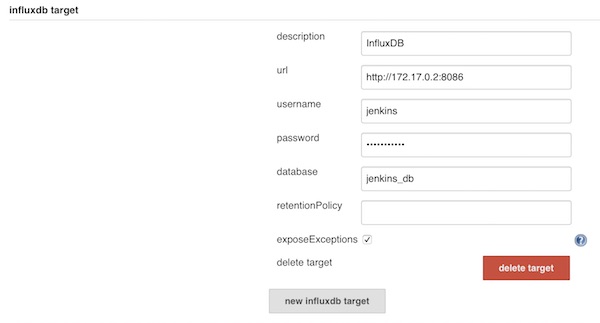
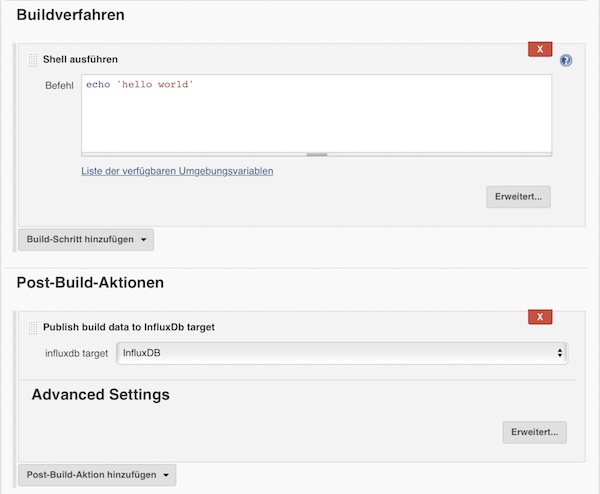
Add new InfluxDB target on Jenkins
Save and create a new freestyle job. For example with following configuration.
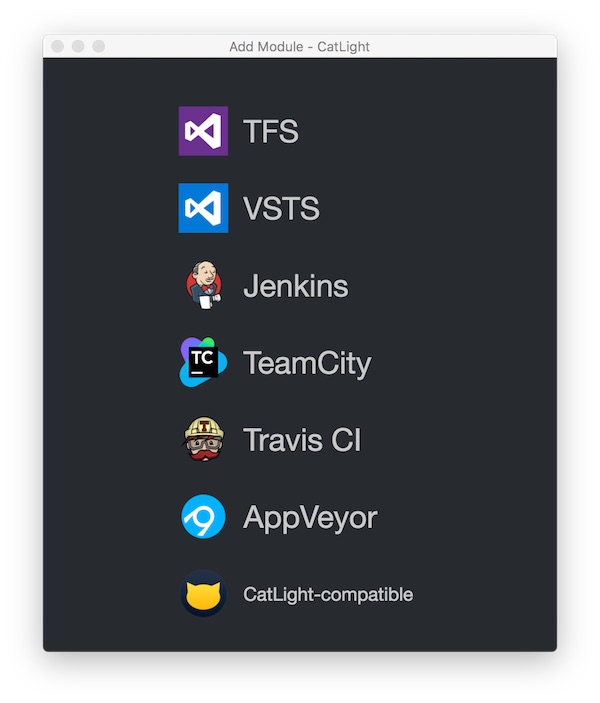
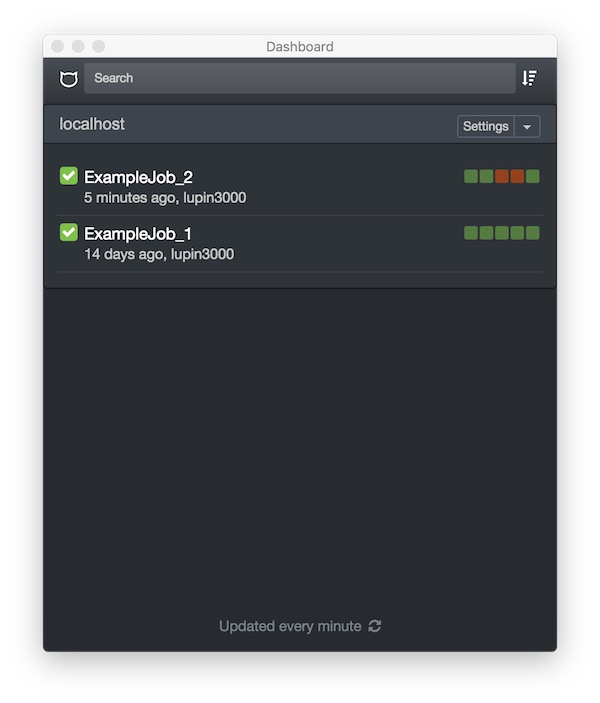
CatLight is the the perfect app if you would like to know the current status of your continuous delivery pipelines, tasks and bugs. Without looking on E-Mails or visit build servers you know when attention is needed. It’s available for Debian, Ubuntu, Windows and MacOS.
There are many ways to install Ansible inside virtualenv on CentOS7, I would like to show now a very simple variant. Important are actually the CentOS packages at the beginning.