Jenkins and Sitespeed.io

While surfing the internet I stumbled across Sitespeed.io. It’s a amazing collection of Open Source Tools, which make performance measuring for developers and testers super easy. I tried it out and was immediately impressed. Here’s a little tutorial on how to use Jenkins and Sitespeed.

Requirements

Docker (latest)

Environment setup

With minimal 2 commands the environment (via Docker) is already created. Most of the time will be needed for the plugins installation.

# create Project
$ mkdir -p ~/Projects/Sitespeed/target && cd ~/Projects/Sitespeed

# pull latest sitespeed image (optional)
$ docker pull sitespeedio/sitespeed.io:latest

# start Jenkins container
$ docker run -e JAVA_OPTS="-Dhudson.model.DirectoryBrowserSupport.CSP=\"sandbox allow-scripts; style-src 'unsafe-inline' *;script-src 'unsafe-inline' *;\"" --name jenkins -v $(pwd)/target:/var/jenkins_home -v /var/run/docker.sock:/var/run/docker.sock -v $(which docker):$(which docker) -p 8080:8080 -p 9000:9000 jenkins/jenkins:lts

# open Jenkins in browser (be patient)
$ open http://localhost:8080

On setup wizard finish: unlock Jenkins, install the suggested plugins, create an account and finish the instance configuration.

Jenkins permissions to /var/run/docker.sock

Before you start with Jenkins job configuration, ensure that user jenkins has permissions to /var/run/docker.sock.

# test permissions
$ docker exec -ti jenkins docker info Got permission denied...

# create group docker
$ docker exec -ti -u 0 jenkins groupadd -for -g 0 docker

# add jenkins to group
$ docker exec -ti -u 0 jenkins usermod -aG docker jenkins

# restart jenkins container
$ docker restart jenkins

Jenkins job configuration

When Jenkins is ready (restarted), install the HTML Publisher PlugIn (no restart after installation of plugin required).

Jenkins HTML Publisher Plugin

Create a new free-style project named SiteSpeed.
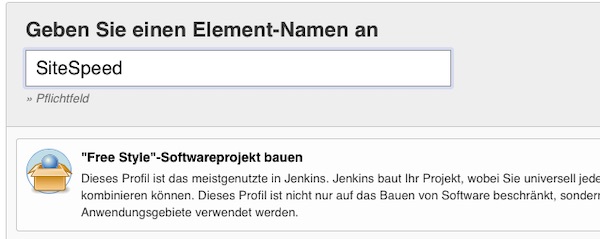
Jenkins SiteSpeed Project

Attention: You need to specify later the absolute path to the local directory /target/workspace/SiteSpeed. If you do not know how, press save and start the build without any job information (empty job configuration) and follow the optional instructions.

# change directory (optional)
$ cd ~/Projects/Sitespeed/target/workspace/SiteSpeed

# get absolute path (optional)
$ pwd

In my case the path is: “/Users/steffen/Projects/Sitespeed/target/workspace/SiteSpeed”. Under job configuration section “Build” enable “Execute shell” and paste following command.

docker run --rm --shm-size=1g -v /Users/steffen/Projects/Sitespeed/target/workspace/SiteSpeed:/sitespeed.io sitespeedio/sitespeed.io --visualMetrics --video --outputFolder output https://www.sitespeed.io/ -n 1

Via Post-Build-Action: Publish HTML reports you can enter the report very simple from the job project page.
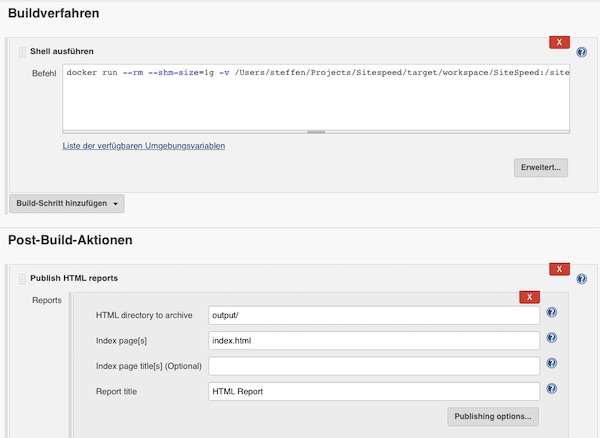
Jenkins SiteSpeed Job Configuration

Save everything and run the job. After a short time you can look at the HTML report. See “Pages” > “https://www.sitespeed.io/” for screenshots, HAR and video files. On the website of sitespeed.io is a very detailed documentation and many more examples. Have fun!
HTTP benchmarking with Bombardier

Bombardier is a nice HTTP(S) benchmarking tool, written in Go language, for software performance testers.

Preparation

# install git and curl packages
$ sudo apt install -y curl git

# download go (do not install from Debian)
$ curl -O https://storage.googleapis.com/golang/go1.8.linux-amd64.tar.gz

# unzip archive
$ tar xvf go1.8.linux-amd64.tar.gz

# set owner and group (recursive)
$ sudo chown -R root:root go

# move all into target directory
$ sudo mv go /usr/local/

Configure go (for user)

# create hidden go directory
$ mkdir ~/.go

# configure needed paths (inside .bashrc)
$ echo "GOPATH=$HOME/.go" >> ~/.bashrc
$ echo "export GOPATH" >> ~/.bashrc
$ echo "PATH=\$PATH:/usr/local/go/bin:\$GOPATH/bin" >> ~/.bashrc

# reload
$ source ~/.bashrc

# check go version
$ go version
go version go1.8 linux/amd64

Install bombardier

# install packages from github
$ go get -u github.com/codesenberg/bombardier

# show bombardier help
$ bombardier --help

Usage/Examples

# run with 5 connections on 10 sec.
$ bombardier -c 5 -k https://www.heise.de
...
Statistics        Avg      Stdev        Max
  Reqs/sec        32.44      37.83        201
  Latency      152.35ms    72.93ms      1.24s
  HTTP codes:
    1xx - 0, 2xx - 329, 3xx - 0, 4xx - 0, 5xx - 0
    others - 0
  Throughput:     6.18MB/s
...

# run with 10 connections on 5 sec and show latency statistics.
$ bombardier -d 5s -c 10 -l -k https://www.heise.de
...
Statistics        Avg      Stdev        Max
  Reqs/sec        56.51      59.10        251
  Latency      173.10ms   102.95ms      1.32s
  Latency Distribution
     50%   155.83ms
     75%   164.06ms
     90%   174.99ms
     99%   542.91ms
  HTTP codes:
    1xx - 0, 2xx - 294, 3xx - 0, 4xx - 0, 5xx - 0
    others - 0
  Throughput:    10.63MB/s
...


Apache Jmeter and Docker

Okay, this time we will create a Docker-Jmeter test environment. We create some simple (but tiny) Docker images/containers which can be reused for future test runs. Here we follow the DRY rule. Next, we want to achieve.

$ java -jar apache-jmeter-3.0/bin/ApacheJMeter.jar -t /tutorial/jmx/simple.jmx -n -l /tutorial/results/log.jtl

Preconditions

Preparation

# create all directories
$ mkdir -p /tutorial/{java,jmeter,jmx,results}

# create Dockerfile for JAVA
$ cd /tutorial/java && vim Dockerfile

# build JAVA image
$ docker build -t alpine/java .

# create Dockerfile for Jmeter
$ cd /tutorial/jmeter && vim Dockerfile

# build Jmeter image
$ docker build -t alpine/jmeter .

# list Docker images (optional)
$ docker images
...
REPOSITORY          TAG                 IMAGE ID            CREATED             SIZE
alpine/jmeter       latest              0864228be6ef        15 seconds ago      150.2 MB
alpine/java         latest              068005f45866        5 minutes ago       102.8 MB
alpine              latest              f70c828098f5        5 days ago          4.795 MB

Dockerfile JAVA

FROM alpine

RUN apk --update add openjdk8-jre-base

ENTRYPOINT ["/usr/bin/java"]

Dockerfile Jmeter

FROM alpine

RUN apk --update add wget
RUN wget http://mirror.switch.ch/mirror/apache/dist//jmeter/binaries/apache-jmeter-3.0.tgz
RUN tar zxvf apache-jmeter-3.0.tgz
RUN apk del wget
RUN rm -f apache-jmeter-3.0.tgz
RUN rm -fr /apache-jmeter-3.0/docs

VOLUME /apache-jmeter-3.0

CMD ["/bin/true"]

JMX file

Create or copy existing JMX file on folder “/tutorial/jmx” with name “simple.jmx”.

# show JMX (optional)
$ ls /tutorial/jmx
...
simple.jmx

Create Jmeter container

# create jmeter container
$ docker create --name jmeter alpine/jmeter

# list containers (optional)
$ docker ps -a
...
CONTAINER ID        IMAGE               COMMAND             CREATED             STATUS      PORTS       NAMES
0916ff8f25bb        alpine/jmeter       "/bin/true"         7 seconds ago       Created                 jmeter

Note: The container was created but not running!

Test execution

# test run JAVA container (optional)
$ docker run -ti --rm --volumes-from jmeter alpine/java -jar /apache-jmeter-3.0/bin/ApacheJMeter.jar --version

# run Jmeter (without report)
$ docker run -ti --rm -v /tutorial/jmx:/jmx --volumes-from jmeter alpine/java -jar /apache-jmeter-3.0/bin/ApacheJMeter.jar -t /jmx/simple.jmx -n

# run Jmeter (with report)
$ docker run -ti --rm -v /tutorial/jmx:/jmx -v /tutorial/results:/results --volumes-from jmeter alpine/java -jar /apache-jmeter-3.0/bin/ApacheJMeter.jar -t /jmx/simple.jmx -n -l /results/log.jtl

# show report
$ cat /tutorial/results/log.jtl

🙂

JMeter and Taurus

Taurus from Blazemeter seems really to have a potential to be a star. There are new and easy ways to ease the workflow with JMeter. It allows, for example, configuration options and reports which JMeter does not offer by default.

Installation

# install via pip
$ sudo pip install bzt

On error look for installed libxml2 and libxslt libraries!

Usage

├── example.jmx
├── example.yml
└── requirements.txt
bzt==0.5.0

You don`t need jMeter or jMeter PlugIns installed! All will automatically downloaded in given path (see YAML).

---
modules:
  jmeter:
    path: ~/.bzt/jmeter-taurus/bin/jmeter
    download-link: http://apache.claz.org/jmeter/binaries/apache-jmeter-{version}.zip
    version: 2.13

execution:
  scenario:
    script: example.jmx
    variables:
      MY_TARGET_HOST: softwaretester.info

reporting:
  - module: console
  - module: final_stats
    summary: true
    percentiles: true
    test-duration: true
  - module: junit-xml
    filename: report/report.xml
    data-source: sample-labels

example.jmx

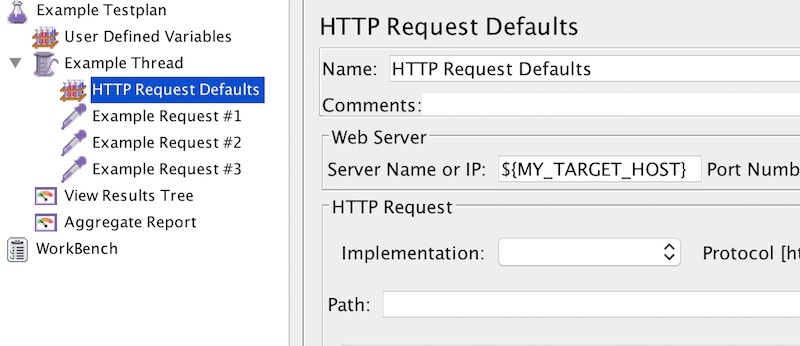
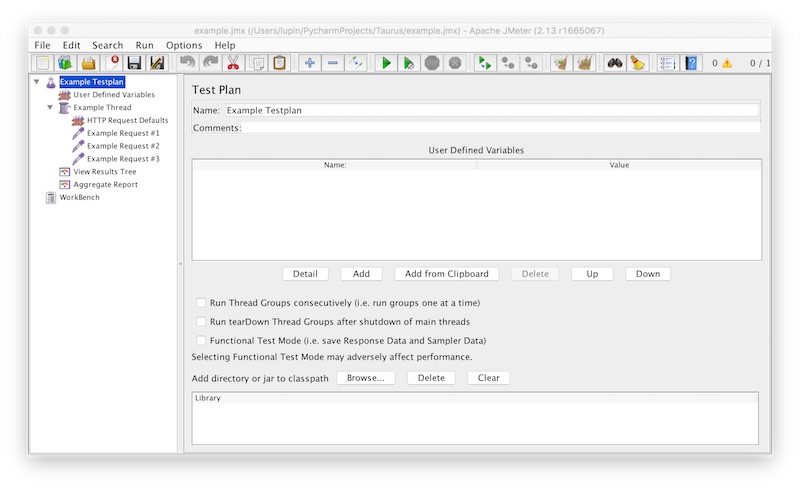
Create a JMeter testplan with “User Defined Variables”, one “Thread” with one “HTTP Request Defaults” and some “HTTP Requests”.

Taurus jMeter Example 1

On “User Defined Variables” – “Name” insert “MY_TARGET_HOST” this value will be set by Taurus YAML file.

Taurus jMeter Example 2

On “HTTP Request Defaults” – “WebServer” use the variable (MY_TARGET_HOST).

Taurus jMeter Example 3

Running JMeter test

# running headless by yaml file
$ bzt example.yml

# running headless by jmx file
$ bzt example.jmx

# running with JMeter GUI by yaml file
$ bzt example.yml -gui

# running with JMeter GUI by jmx file
$ bzt example.jmx -gui

Two folders will created on each test run. “report” (configured in YAML) and “Artifacts” (as Date/Time string). Attention – report.xml will replaced on each run!

HAR with Python WebDriver and BrowserMob Proxy

This time is shown how to automate performance test for web sites. Tools in usage are Python Selenium WebDriver and BrowserMob proxy. The results are HAR files which can be viewed in HAR Viewer.

Precondition

  • JAVA installed
  • Python Packages for selenium and browsermob-proxy
selenium
browsermob-proxy

Preparation

Download BrowserMob Proxy and check if proxy can started by command-line.

# change to 
$ cd browsermob-proxy-2.1.0-beta-1/bin/

# start proxy on port 9090
$ ./browsermob-proxy -port 9090

Create Python Class

#!/usr/bin/env python
# -*- coding: utf-8 -*-
"""Python - BrowserMob - WebDriver"""
from browsermobproxy import Server
from selenium import webdriver
import json


class CreateHar(object):
    """create HTTP archive file"""

    def __init__(self, mob_path):
        """initial setup"""
        self.browser_mob = mob_path
        self.server = self.driver = self.proxy = None

    @staticmethod
    def __store_into_file(title, result):
        """store result"""
        har_file = open(title + '.har', 'w')
        har_file.write(str(result))
        har_file.close()

    def __start_server(self):
        """prepare and start server"""
        self.server = Server(self.browser_mob)
        self.server.start()
        self.proxy = self.server.create_proxy()

    def __start_driver(self):
        """prepare and start driver"""
        profile = webdriver.FirefoxProfile()
        profile.set_proxy(self.proxy.selenium_proxy())
        self.driver = webdriver.Firefox(firefox_profile=profile)

    def start_all(self):
        """start server and driver"""
        self.__start_server()
        self.__start_driver()

    def create_har(self, title, url):
        """start request and parse response"""
        self.proxy.new_har(title)
        self.driver.get(url)
        result = json.dumps(self.proxy.har, ensure_ascii=False)
        self.__store_into_file(title, result)

    def stop_all(self):
        """stop server and driver"""
        self.server.stop()
        self.driver.quit()


if __name__ == '__main__':
    path = "browsermob-proxy-2.1.0-beta-1/bin/browsermob-proxy"
    RUN = CreateHar(path)
    RUN.start_all()
    RUN.create_har('google', 'http://google.com')
    RUN.create_har('stackoverflow', 'http://stackoverflow.com')
    RUN.stop_all()

Note: The highlighted line must contain the path to BrowserMob Proxy!
Happy testing! If you use PhantomJS instead of Firefox, you can use this on Build server like Jenkins/Hudson and so on, too.

Performance measurement with PhantomJS and confess

PhantomJS and confess make it possible to measure your webapplication performance via command-line.

Precondition

Preparation

If your PhantomJS version >= 2.0, phantom.args is deprecated! “TypeError: undefined is not an object” You have to make a quick hack inside the confess.js file.

# add in top of file
var system = require('system');

# replace all
phantom.args
# by
system.args

# change
var a = 0;
# into
var a = 1;

Run the performance measurement

# change to folder with confess.js and config.json
$ cd /path/to/folder

# generation of an appcache manifest
$ phantomjs confess.js <URL> appcache

# run performance measurement
$ phantomjs confess.js <URL> performance

Note: By default the results go to stdout, but you can pipe into a file!

Dynamic data for JMeter

Preparation

JAVA and JMeter are already installed.

Steps

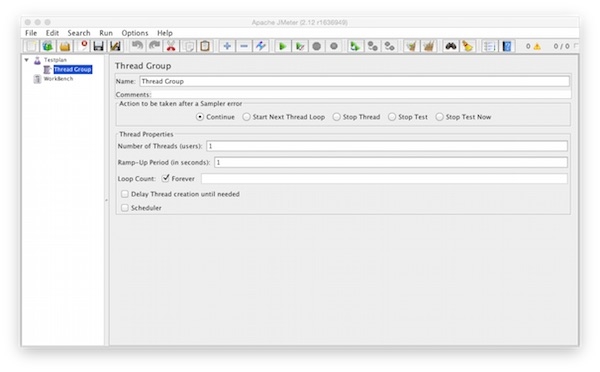
Create new “Test Plan” and add one “Thread Group” (Threads (Users)).

  • Number of Threads: 1
  • Ramp-Up Period: 1
  • Loop Count Forever: checked
meter thread group

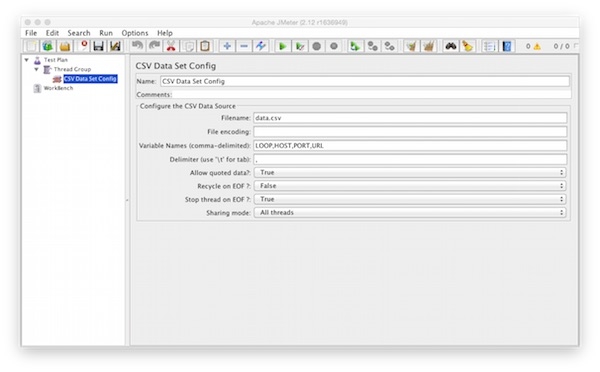
Add to the “Thread Group” one “CSV Data Set Config” (Config Element).

  • Filename: Path to your CSV file
  • Variable Names: LOOP,HOST,PORT,URL
  • Delimiter: ,
  • Allow quoted data: true
  • Recycle on EOF: false
  • Stop thread on EOF: true
jmeter csv data set config

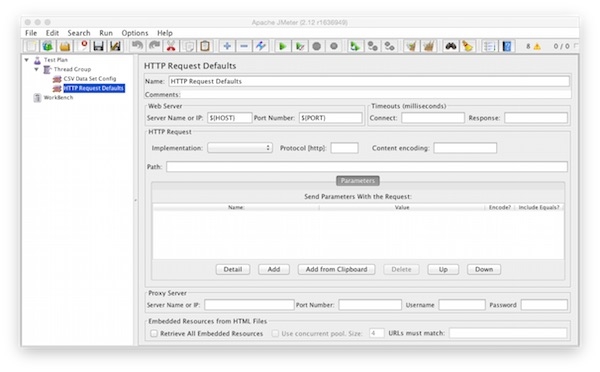
Add to the “Thread Group” one “HTTP Request Defaults” (Config Element).

  • Server Name or IP: ${HOST}
  • Port Number: ${PORT}
jmeter http request defaults

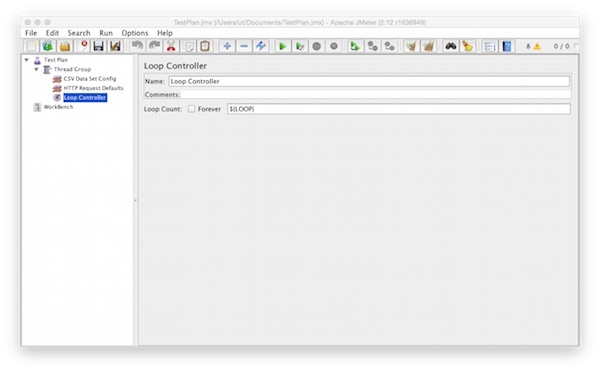
Add to the “Thread Group” one “Loop Controller” (Logic Controller).

  • Loop Count: ${LOOP}
  • Forever: not checked
jmeter loop controller

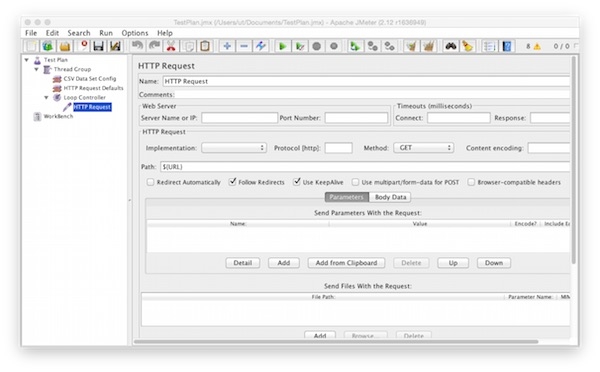
Add to the “Loop Controller” one “HTTP Request” (Sampler).

  • Method: GET
  • Path: ${URL}
  • Follow Redirects: checked
  • Use KeepAlive: checked
jmeter http request

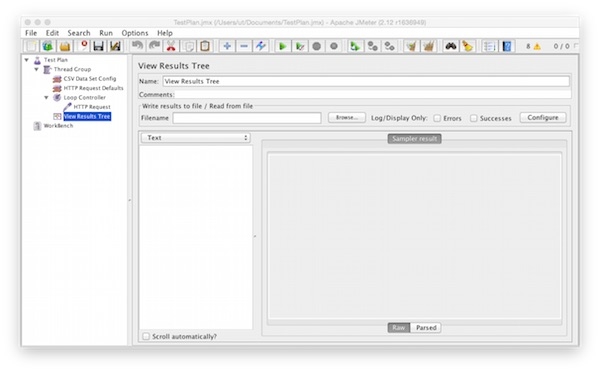
Add to the “Thread Group” one “View Results Tree” (Listener).

meter view result tree

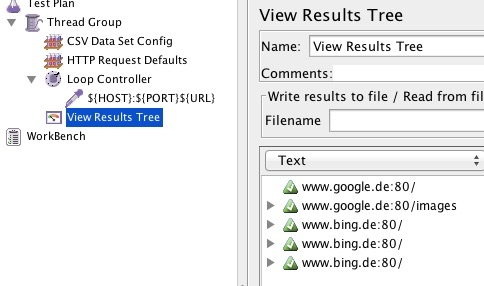
Rename the “HTTP Request” into “${HOST}:${PORT}${URL}”.

jmeter http request extension

Create the CSV file with some comma separated values (LOOP,HOST,PORT,URL).

jmeter csv

Run

Save the test plan as JMX file and run the test plan.

jmeter result