PHP QA Tools and Docker Jenkins

This Tutorial is about some simple PHP QA Tools and Docker Jenkins. I will show near how to install PHP and PHP Composer in an Jenkins Alpine Linux Docker inclusive some needed Jenkins PlugIns.

Note

If you have an running Docker Container already which you cannot stop, you can install needed packages directly via:

# list containers (optional)
$ docker ps -a

# access running container as root
$ docker exec -u 0 -it <Container Name> sh

# install packages and exit container
...

Now you can use the same commented commands as provided via Dockerfile. Otherwise follow next steps.

Let’s go

# create new project
$ mkdir -p ~/Projects/DockerJenkins && cd ~/Projects/DockerJenkins/

# create Dockerfile and plugins.txt
$ touch Dockerfile plugins.xt

# modify Dockerfile
$ vim Dockerfile

# modify plugins.txt
$ vim plugins.txt
FROM jenkins/jenkins:lts-alpine

USER root

RUN apk update && apk upgrade

# install needed libary packages
RUN apk --no-cache add libssh2 libpng freetype libjpeg-turbo libgcc \
libxml2 libstdc++ icu-libs libltdl libmcrypt

# install needed PHP packages
RUN apk --no-cache add php7 php7-fpm php7-opcache php7-gd php7-pdo_mysql \
php7-mysqli php7-mysqlnd php7-mysqli php7-zlib php7-curl php7-phar \
php7-iconv php7-pear php7-xml php7-pdo php7-ctype php7-mbstring \
php7-soap php7-intl php7-bcmath php7-dom php7-xmlreader php7-openssl \
php7-tokenizer php7-simplexml php7-json

# Download and install composer installer
RUN php -r "copy('https://getcomposer.org/installer', 'composer-setup.php');"
RUN php -r "if (hash_file('SHA384', 'composer-setup.php') === '544e09ee996cdf60ece3804abc52599c22b1f40f4323403c44d44fdfdd586475ca9813a858088ffbc1f233e9b180f061') { echo 'Installer verified'; } else { echo 'Installer corrupt'; unlink('composer-setup.php'); } echo PHP_EOL;"
RUN php composer-setup.php
RUN mv composer.phar /usr/local/bin/composer
RUN chmod +x /usr/local/bin/composer
RUN rm -f composer-setup.php

USER jenkins

# install plugins from plugins.txt
COPY plugins.txt /usr/share/jenkins/ref/plugins.txt
RUN /usr/local/bin/install-plugins.sh < /usr/share/jenkins/ref/plugins.txt
checkstyle:3.50
analysis-core:1.95
dry:2.50
pmd:3.50
violations:0.7.11

That was it! Now build the image, start and work with jenkins.

# build image from Dockerfile
$ docker build -t lupin/jenkins:lts-alpine .

# list images (optional)
$ docker images

# start container
$ docker run --name JenkinsPHP -p 8080:8080 lupin/jenkins:lts-alpine

Test

After starting, configuring and logging, you can see the already installed plugins in the Jenkins PlugIns!
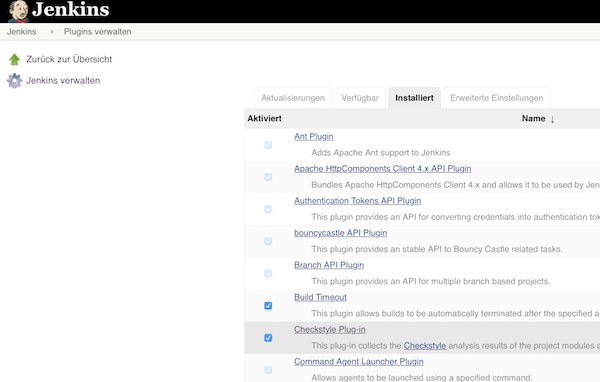
Jenkins PlugIns

To test, you can create a simple freestyle job. Here you configure the repository, build steps and post-build actions. After a few runs, the results should be visible on the project side.
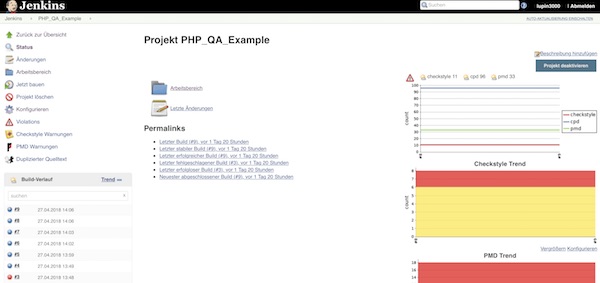
Jenkins Build Results

Docker, Telegraf, InfluxDB and Grafana

I have already presented various tutorials on docker monitoring. This time we will use Telegraf.

Project preparation

# create new project
$ mkdir -p Projects/DTIG/influxdb && cd Projects/DTIG/

# create telegraf.conf
$ touch telegraf.conf

InfluxDB preparation

# start InfluxDB
$ docker run --name influxdb -p 8086:8086 -v $PWD/influxdb:/var/lib/influxdb influxdb

# create new user
$ curl -G http://localhost:8086/query --data-urlencode "q=CREATE USER telegraf WITH PASSWORD 'password123' WITH ALL PRIVILEGES"

# create database for telegraf
$ curl -G http://localhost:8086/query -u telegraf:password123 --data-urlencode "q=CREATE DATABASE telegraf_db"

# show ip of influxdb container
$ docker inspect --format '{{ .NetworkSettings.IPAddress }}' influxdb
...
172.17.0.2
...

Telegraf preparation

# Telegraf Configuration

[agent]
  interval = "10s"
  round_interval = true
  metric_batch_size = 1000
  metric_buffer_limit = 10000
  collection_jitter = "0s"
  flush_interval = "10s"
  flush_jitter = "0s"
  precision = ""
  debug = false
  quiet = false
  logfile = ""
  hostname = ""
  omit_hostname = false

[[outputs.influxdb]]
  urls = ["http://172.17.0.2:8086"] # required
  database = "telegraf_db" # required
  retention_policy = ""
  write_consistency = "any"
  timeout = "5s"

[[inputs.cpu]]
  percpu = true
  totalcpu = true
  collect_cpu_time = false

[[inputs.disk]]
  ignore_fs = ["tmpfs", "devtmpfs", "devfs"]

[[inputs.docker]]
  endpoint = "unix:///var/run/docker.sock"
  container_names = []
  timeout = "5s"
  perdevice = true
  total = false
  # docker_label_include = []
  # docker_label_exclude = []

… Read more about Telegraf on documentation page …

# edit telegraf.conf
$ vim telegraf.conf

# start Telegraf
$ docker run --name telegraf -v $PWD/telegraf.conf:/etc /telegraf/telegraf.conf -v /var/run/docker.sock:/var/run/docker.sock telegraf

Note: The space after /etc is just because of security settings of my provider.

… after short time …

# show measurements (be patient)
$ curl -G http://localhost:8086/query -u telegraf:password123 --data-urlencode "db=telegraf_db" --data-urlencode "q=SHOW MEASUREMENTS"

Grafana preparation

# run grafana container
$ docker run --name grafana -i -p 3000:3000 grafana/grafana

# open Grafana WebUI and login (admin:admin)
$ open -a Safari http://localhost:3000

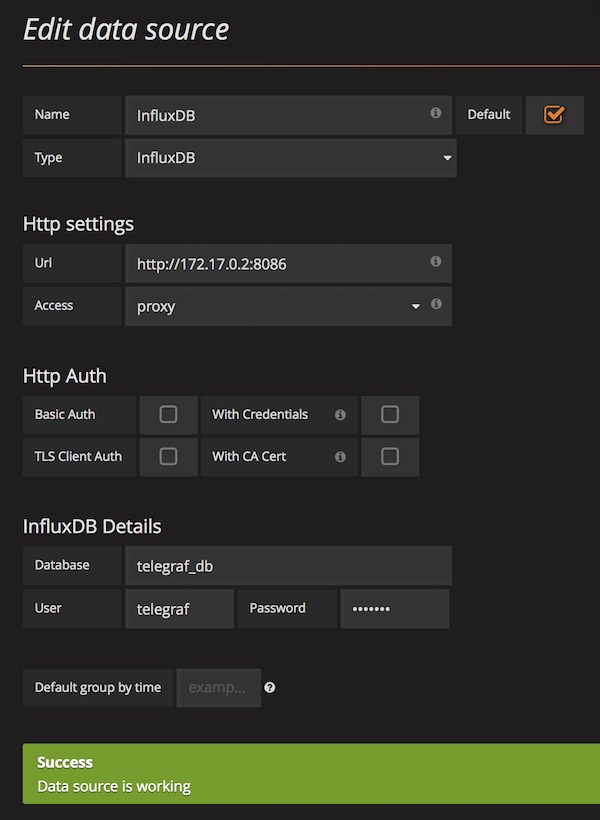
After login (admin:admin) you can add new Data Source.

Grafana InfluxDB Telegraf DataSource

Okay … all done … you can start to create Dashboards or search for existing Dashboards for import.

Docker, cAdvisor, InfluxDB and Grafana

In previous tutorials I showed the basics for docker monitoring with Prometheus and Jenkins. Here are now the basics with cAdvisor. Many steps are similar and can be implemented just as quickly.

Preparation

# create project
$ mkdir -p Projects/DCIG/influxdb && cd Projects/DCIG/

InfluxDB preparation

This time we start with InfluxDB, because cAdvisor needs it for connection!

# start InfluxDB
$ docker run --name influxdb -p 8086:8086 -v $PWD/influxdb:/var/lib/influxdb influxdb

# create new user
$ curl -G http://localhost:8086/query --data-urlencode "q=CREATE USER cadvisor WITH PASSWORD 'password123' WITH ALL PRIVILEGES"

# create database for cadvisor
$ curl -G http://localhost:8086/query -u cadvisor:password123 --data-urlencode "q=CREATE DATABASE cadvisor_db"

# show ip of influxdb container
$ docker inspect --format '{{ .NetworkSettings.IPAddress }}' influxdb
...
172.17.0.2
...

cAdvisor preparation

Now we will use User, Password and Database name. You can find the documentation here.

# start cAdvisor
$ docker run -d --name=cadvisor -v /:/rootfs:ro -v /var/run:/var/run:rw -v /sys:/sys:ro -v /var/lib/docker/:/var/lib/docker:ro -p 8080:8080 google/cadvisor:latest -storage_driver=influxdb -storage_driver_db=cadvisor_db -storage_driver_user=cadvisor -storage_driver_password=password123 -storage_driver_host=172.17.0.2:8086

# check cAdvisor logs (optional)
$ docker logs -f cadvisor

# open cAdvisor WebUI
$ open -a Safari http://localhost:8080

After a while we can also see if cAdvisor sends metrics to InfluxDB.

# show measurements (be patient)
$ curl -G http://localhost:8086/query -u cadvisor:password123 --data-urlencode "db=cadvisor_db" --data-urlencode "q=SHOW MEASUREMENTS"

prepare and run Grafana

# run grafana container
$ docker run --name grafana -i -p 3000:3000 grafana/grafana

# open Grafana WebUI and login (admin:admin)
$ open -a Safari http://localhost:3000

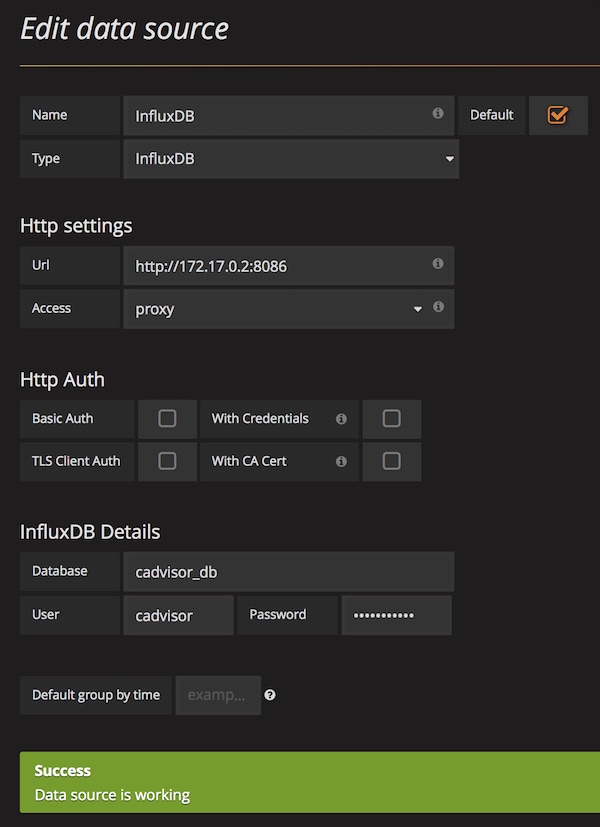
After login (admin:admin) configure new DataSource for InfluxDB.

DataSource InfluxDB

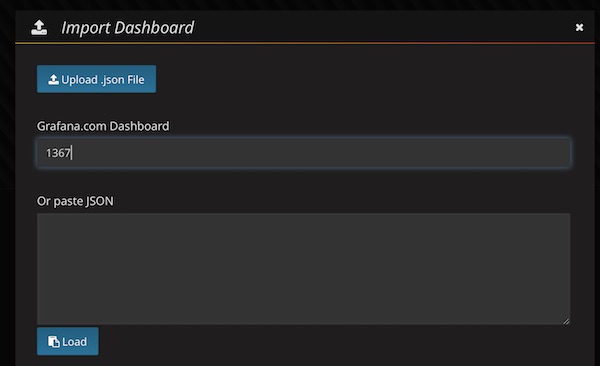
When DataSource is configured we import the Grafana Dashboard. (ID: 1367)

Dashboard Search cAdvisor

… be patient (don’t press any button) …

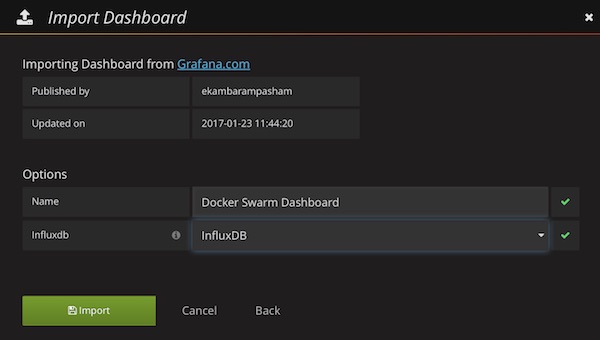
Import cAdvisor Dashboard

Select already created DataSource (InfluxDB) and press “Import” button. Now you should see the Grafana Dashboard.

macOS, Docker, Prometheus and Grafana

I like Grafana … the dashboards are just cool! Here (again) a tutorial about docker monitoring. In less minutes you should be done. As a comment … for Linux and Windows you can do that too! There are only partial changes.

Prepare Project

# create project
$ mkdir -p ~/Projects/DPG && cd ~/Projects/DPG

# show current IP
$ ifconfig | grep "inet " | grep -v 127.0.0.1

# create and edit prometheus.yml
$ vim prometheus.yml

Replace <yourLocalIP> with your IP. On Docker website you can find templates for Linux and Windows, too!

# my global config
global:
  scrape_interval:     15s # Set the scrape interval to every 15 seconds. Default is every 1 minute.
  evaluation_interval: 15s # Evaluate rules every 15 seconds. The default is every 1 minute.
  # scrape_timeout is set to the global default (10s).

  # Attach these labels to any time series or alerts when communicating with
  # external systems (federation, remote storage, Alertmanager).
  external_labels:
      monitor: 'codelab-monitor'

# Load rules once and periodically evaluate them according to the global 'evaluation_interval'.
rule_files:
  # - "first.rules"
  # - "second.rules"

# A scrape configuration containing exactly one endpoint to scrape:
# Here it's Prometheus itself.
scrape_configs:
  # The job name is added as a label `job=<job_name>` to any timeseries scraped from this config.
  - job_name: 'prometheus'

    # metrics_path defaults to '/metrics'
    # scheme defaults to 'http'.

    static_configs:
      - targets: ['localhost:9090']

  - job_name: 'docker'
         # metrics_path defaults to '/metrics'
         # scheme defaults to 'http'.

    static_configs:
      - targets: ['<yourLocalIP>:9323']

Configure Docker

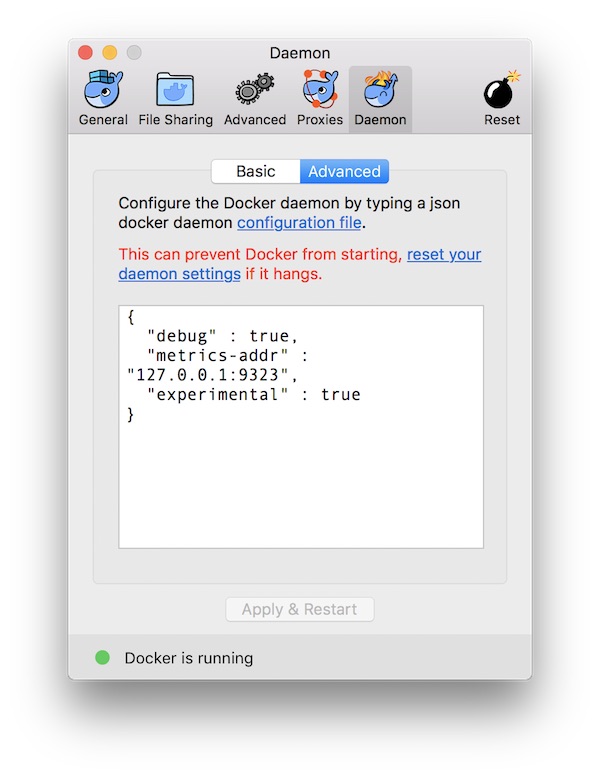
This step is very easy. Just open Docker “Preferences” and specify in section “Daemon” -> “Advanced” the metrics-address. Just ensure that you use valid JSON!

macOS Docker Metrics

When you are done, press “Apply and Restart” button.

# view Docker metrics in browser
$ open -a Safari http://127.0.0.1:9323/metrics

Prepare Prometheus

# run Prometheus
$ docker run --name prometheus -p 9090:9090 -v $PWD/prometheus.yml:/etc /prometheus/prometheus.yml prom/prometheus

# open Prometheus WebUI
$ open -a Safari http://localhost:9090/targets

# get Prometheus IP
$ docker inspect --format '{{ .NetworkSettings.IPAddress }}' prometheus

Note: The space after /etc is just because of security settings of my provider! Please remove the space.

prometheus WebUI

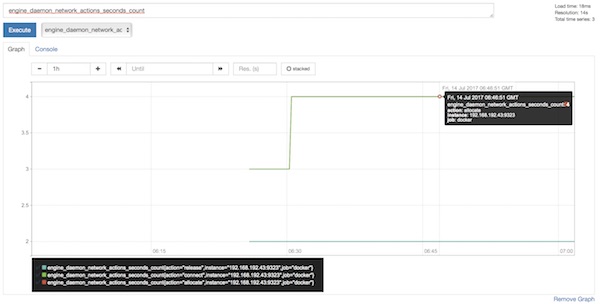
Just for fun you can create already some graphs in Prometheus.

prometheus Graph

Prepare and run Grafana

# run Grafana
$ docker run --name grafana -i -p 3000:3000 grafana/grafana

# open Grafana WebUI and login (admin:admin)
$ open -a Safari http://localhost:3000

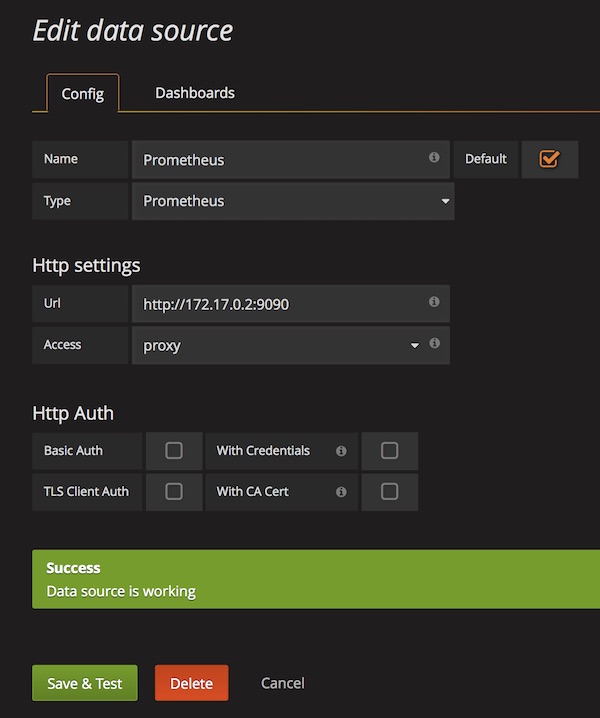
After login (admin:admin) configure new DataSource for Prometheus.

Grafana DataSource Prometheus

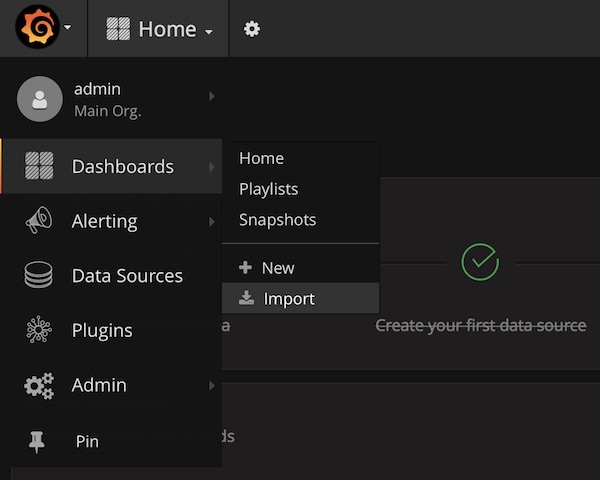
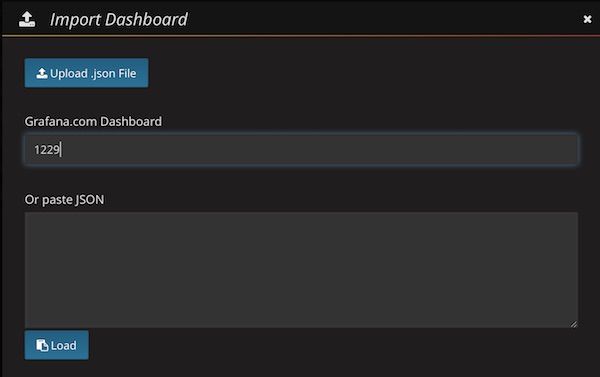
Import Dashboard (ID: 1229)

Grafana Import Dashboard

… enter ID 1229 …

Grafana Dashboard Search

… be patient (don’t press any button) …

Docker Engine Metrics Dashboard

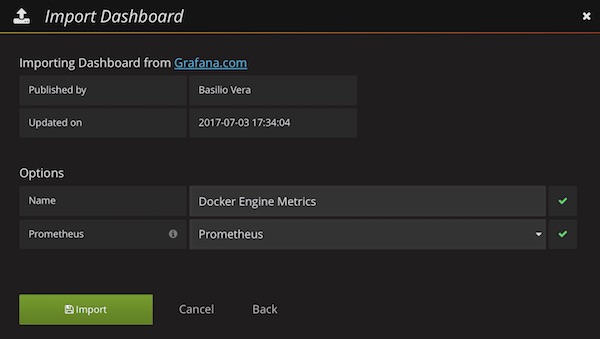
Select already created DataSource (Prometheus) and press “Import” button. Now you should see the awesome Grafana Dashboard.

Jenkins, InfluxDB and Grafana

Today an basic introduction to Jenkins, InfluxDB and Grafana. Docker is used to save some time. Okay,… let’s start.

Preparation

# create project and change directory
$ mkdir ~/Projects/JIG/influxdb && cd ~/Projects/JIG/

# download official jenkins image (latest)
$ docker pull jenkins

# download official influxdb image (latest)
$ docker pull influxdb

# download official grafana image (latest)
$ docker pull grafana/grafana

# list docker images
$ docker images
...
REPOSITORY          TAG                 IMAGE ID            CREATED             SIZE
jenkins             latest              59b08e8f6e37        4 days ago          704 MB
grafana/grafana     latest              2cdb407c0fa4        7 days ago          286 MB
influxdb            latest              fad81160f2de        13 days ago         224 MB
...

Jenkins preparation

# start Jenkins
$ docker run --name jenkins -p 8080:8080 jenkins

# copy password from cli
...
*************************************************************

Jenkins initial setup is required. An admin user has been created and a password generated.
Please use the following password to proceed to installation:

b49ffa5749724d61b43d3a159b181133
...

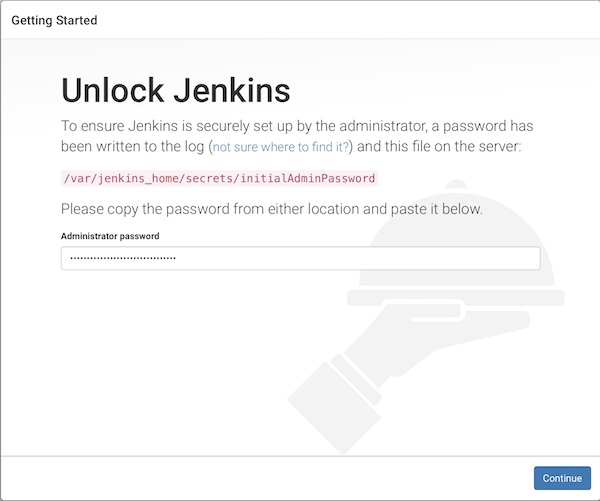
Now open your favorite browser with URL http://localhost:8080 and unlook Jenkins with following steps.

unlook jenkins

  1. unlook with password from cli
  2. install suggested plugins
  3. create your admin user
  4. start using jenkins

Next, the InfluxDB plug-in must be installed.

influxdb plugin jenkins

InfluxDB preparation

# start InfluxDB
$ docker run --name influxdb -p 8086:8086 -v $PWD/influxdb:/var/lib/influxdb influxdb

# check current configuration (optional)
$ docker exec -i influxdb influxd config

# create new user
$ curl -G http://localhost:8086/query --data-urlencode "q=CREATE USER jenkins WITH PASSWORD 'password123' WITH ALL PRIVILEGES"

# create database for jenkins
$ curl -G http://localhost:8086/query -u jenkins:password123 --data-urlencode "q=CREATE DATABASE jenkins_db"

# show users (optional)
$ curl -G http://localhost:8086/query -u jenkins:password123 --data-urlencode "q=SHOW USERS"
...
{"results":[{"statement_id":0,"series":[{"columns":["user","admin"],"values":[["jenkins",true]]}]}]}
...

# show databases (optional)
$ curl -G http://localhost:8086/query -u jenkins:password123 --data-urlencode "q=SHOW DATABASES"
...
{"results":[{"statement_id":0,"series":[{"name":"databases","columns":["name"],"values":[["_internal"],["jenkins_db"]]}]}]}
...

# show measurements
$ curl -G http://localhost:8086/query -u jenkins:password123 --data-urlencode "db=jenkins_db" --data-urlencode "q=SHOW MEASUREMENTS"
...
{"results":[{"statement_id":0}]}
...

Connect Jenkins with InfluxDB

# start jenkins container (if stopped)
$ docker start jenkins

# show ip of influxdb container
$ docker inspect --format '{{ .NetworkSettings.IPAddress }}' influxdb
...
172.17.0.2
...

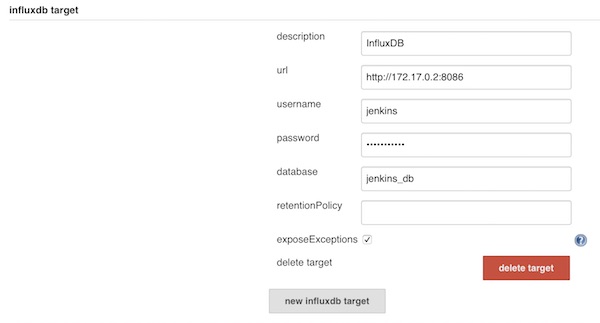
Add new InfluxDB target on Jenkins

jenkins influxdb settings

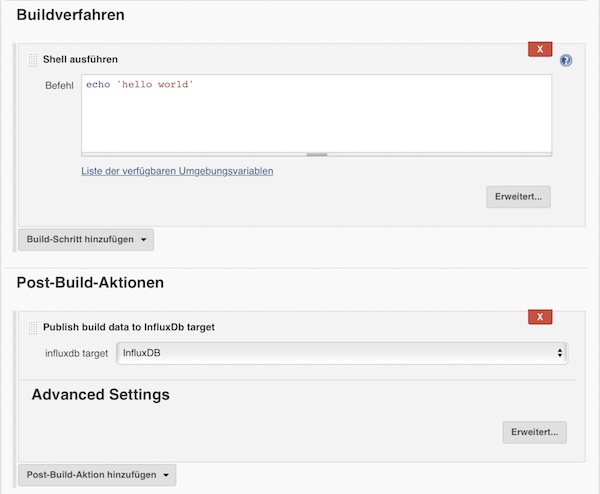
Save and create a new freestyle job. For example with following configuration.

jenkins job influxdb

When you are done, run the job.

# show measurements
$ curl -G http://localhost:8086/query -u jenkins:password123 --data-urlencode "db=jenkins_db" --data-urlencode "q=SHOW MEASUREMENTS"
...
{"results":[{"statement_id":0,"series":[{"name":"measurements","columns":["name"],"values":[["jenkins_data"]]}]}]}
...

# run select statement (optional)
$ curl -G http://localhost:8086/query -u jenkins:password123 --data-urlencode "db=jenkins_db" --data-urlencode "q=SELECT * FROM jenkins_data"
...
{"results":[{"statement_id":0,"series":[{"name":"jenkins_data","columns":["time","build_number","build_result","build_result_ordinal","build_status_message","build_successful","build_time","last_stable_build","last_successful_build","project_build_health","project_name","project_name_1"],"values":[["2017-06-08T17:27:24.487Z",9,"SUCCESS",0,"stable",true,16,9,9,100,"test","test"]]}]}]}
...

Add Grafana

# start containers (if stopped)
$ docker start influxdb && docker start jenkins

# run grafana container
$ docker run --name grafana -i -p 3000:3000 grafana/grafana

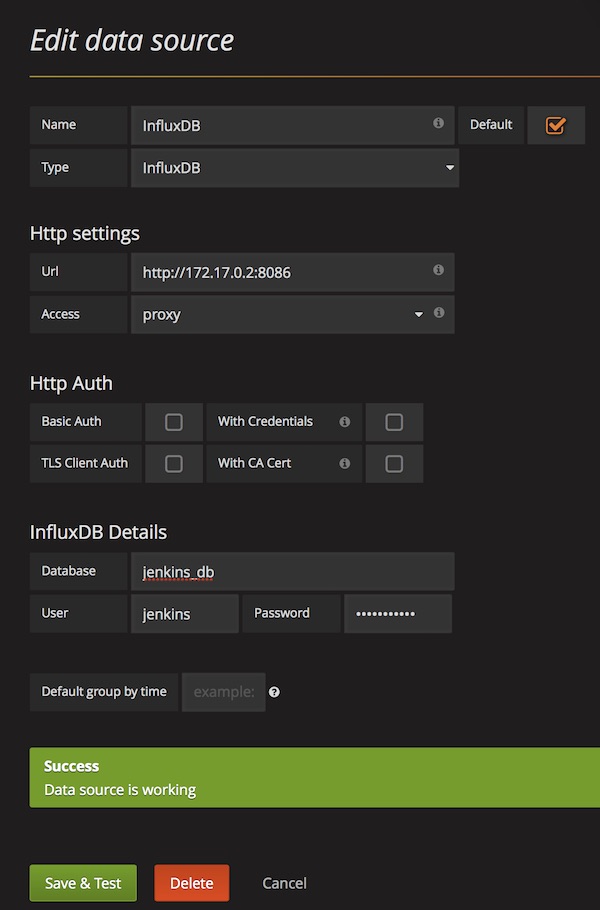
Open you browser with URL http://localhost:3000, login with credentials (admin/admin) and add a new InfluxDB data source.

grafana data source

From now on, you can create and share dashboards in Grafana, which shows all Jenkins metrics.

Build notifications with CatLight

CatLight is the the perfect app if you would like to know the current status of your continuous delivery pipelines, tasks and bugs. Without looking on E-Mails or visit build servers you know when attention is needed. It’s available for Debian, Ubuntu, Windows and MacOS.

CatLight works with Jenkins, TFS, Travis CI and many more.

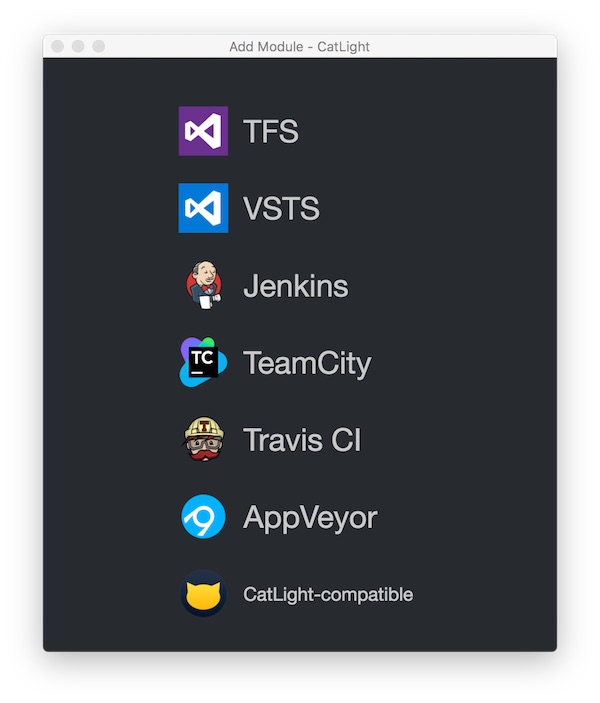
catlight setup

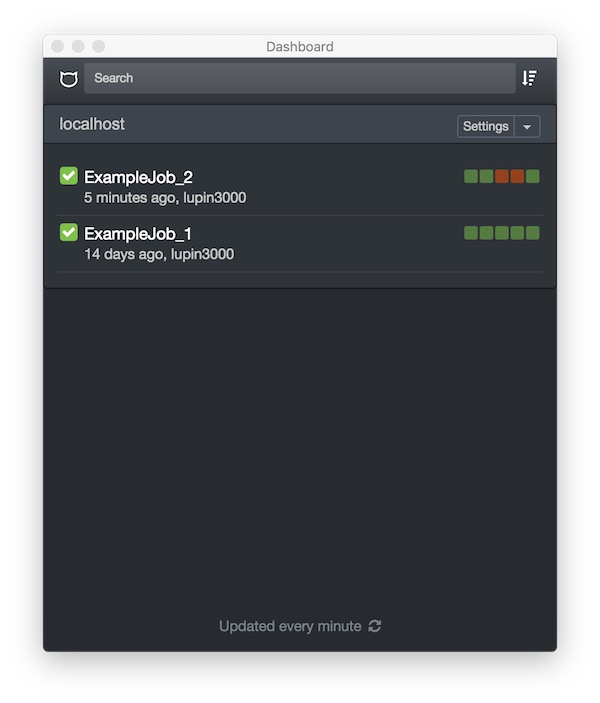
After successful installation and configuration, CatLight offers a lot of cool features.

catlight jobs

For personal usage it’s free, you only have to register.

Test your infrastructure

Infrastructures can be very big. Luckily, there are provisioner like Chef, Salt, Ansible and etc. These provisioners can be very complex and possibly the developer has done something wrong. Therefore the infrastructure has to be tested! Tools like goss, Serverspec and Testinfra helps testers to validate. This tutorial show the first steps with Testinfra.

Testinfra is written in Python very small and easy to understand. Here is the GitHub repository.

Precondition

  • Vagrant (min. 1.9.3) installed
  • Python (min. 2.7) installed
  • pip (min. 9.0.1) and virtualenv (min. 15.1.0) installed
  • make (min. 3.81) installed

Project structure

To get used to it – i prepared some files for you. You only need to change the box name/url in Vagrantfile.

$ tree
.
├── Makefile
├── requirements.txt
├── Vagrantfile
└── tests.py
ENV_DIR = .env
CURRENT_DIR := $(shell pwd)
INTERPRETER = $(CURRENT_DIR)/$(ENV_DIR)/bin/
PATH := ${PATH}:$(INTERPRETER)

help:
	@echo "run make <target> with:"
	@echo " > env       : create virtualenv directory $(ENV_DIR)"
	@echo " > deps      : install dependencies from requirements.txt"
	@echo " > clean_env : delete virtualenv directory $(ENV_DIR)"
	@echo " > up        : run vagrant up"
	@echo " > destroy   : run vagrant destroy"
	@echo " > test      : run testinfra on vagrant environment"
	@echo " > clean_all : delete all files and directories"

env:
	@echo "[RUN]: create virtualenv"
	virtualenv $(ENV_DIR) && \
	. $(ENV_DIR)/bin/activate && \
	make deps

deps:
	@echo "[RUN]: install dependencies"
	$(INTERPRETER)/pip install -r requirements.txt

up:
	@echo "[RUN]: vagrant up"
	vagrant up

destroy:
	@echo "[RUN]: vagrant destroy -f"
	vagrant destroy -f
	rm -fr $(CURRENT_DIR)/.vagrant

test:
	@echo "[RUN]: run testinfr on vagrant environment"
	vagrant ssh-config > $(CURRENT_DIR)/ssh-config
	$(INTERPRETER)/pytest -v --hosts=default --ssh-config=$(CURRENT_DIR)/ssh-config tests.py

clean_all:
	@echo "[RUN]: delete all files and directories"
	rm -fr $(CURRENT_DIR)/.cache $(CURRENT_DIR)/__pycache__
	rm -f $(CURRENT_DIR)/ssh-config
	make destroy
	make clean_env

clean_env:
	@echo "[RUN]: delete virtualenv"
	rm -fr $(ENV_DIR)
testinfra==1.5.4
paramiko==2.1.2
#!/usr/bin/env python

def test_system_type(SystemInfo):
    '''Check OS type'''
    type = SystemInfo.type
    assert type == 'linux'

def test_user_exists(User):
    '''Check user exists'''
    user = User('vagrant')
    assert user.exists

def test_firewalld_is_installed(Package):
    '''Check firewalld is installed'''
    package = Package('firewalld')
    assert package.is_installed

def test_firewalld_running_and_enabled(Service):
    '''Check firewalld service is running and enabled'''
    service = Service('firewalld')
    assert service.is_running
    assert service.is_enabled
# -*- mode: ruby -*-
# vi: set ft=ruby :

Vagrant.configure("2") do |config|

  # disable ssh key update
  config.ssh.insert_key = false

  # vagrant box name
  config.vm.box = ""

  # vagrant box url
  config.vm.box_url = ""

  # disable box update
  config.vm.box_check_update = false

  # disable synced_folder
  config.vm.synced_folder ".", "/vagrant", disabled: true

  # 2nd network interface (public)
  # config.vm.network "public_network"

  # virtualbox settings
  config.vm.provider "virtualbox" do |vb|
    vb.name = "example_vm"
    vb.cpus = "2"
    vb.memory = "2048"
    vb.gui = false
  end

end

Usage

# create virtualenv and install dependencies
$ make env

# create vagrant environment
$ make up

# run tests
$ make test

# delete all generated files and directories
$ make clean_all

Testinfra offers several connections backends for remote command execution and can be used with python standard unit test framework: unittest. So the integration with build servers is easily possible.

Visualisation of Docker and Kubernetes

With Weave Scope you have in seconds a beautiful monitoring, visualisation & management for Docker and Kubernetes via your browser. I show with Docker-Selenium a simple example.

Preconditions

Lets go…

# create new Docker VM (local)
$ docker-machine create -d virtualbox WeaveScope

# pointing shell to WeaveScope VM (local)
$ eval $(docker-machine env WeaveScope)

# SSH into WeaveScope VM (local -> VM)
$ docker-machine ssh WeaveScope

# become root (VM)
$ sudo su -

# download scope (VM)
$ wget -O /usr/local/bin/scope https://git.io/scope

# change access rights of scope (VM)
$ chmod a+x /usr/local/bin/scope

# launch scope (VM)
# Do not forget the shown URL!!!
$ scope launch

# exit root and ssh (VM -> local)
$ exit

# create Selenium Hub (local)
$ docker run -d -p 4444:4444 --name selenium-hub selenium/hub:2.53.0

# create Selenium Chrome Node (local)
$ docker run -d --link selenium-hub:hub selenium/node-chrome:2.53.0

# create Selenium Firefox Node (local)
$ docker run -d --link selenium-hub:hub selenium/node-firefox:2.53.0

# show running containers (optional)
$ docker ps -a
...
CONTAINER ID        IMAGE                          COMMAND                  CREATED             STATUS              PORTS                    NAMES
a3e7b11c5a5f        selenium/node-firefox:2.53.0   "/opt/bin/entry_point"   9 seconds ago       Up 8 seconds                                 cocky_wing
699bf05681e8        selenium/node-chrome:2.53.0    "/opt/bin/entry_point"   42 seconds ago      Up 42 seconds                                distracted_darwin
bbc5f545261b        selenium/hub:2.53.0            "/opt/bin/entry_point"   2 minutes ago       Up 2 minutes        0.0.0.0:4444->4444/tcp   selenium-hub
9fe4e406fb50        weaveworks/scope:0.16.0        "/home/weave/entrypoi"   5 minutes ago       Up 5 minutes                                 weavescope

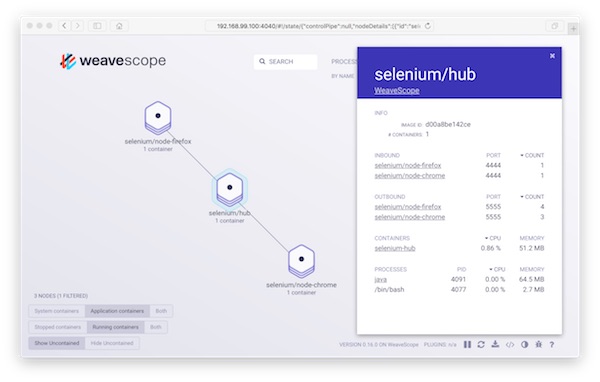
That’s it! Now start your browser and open the URL.

weavescope browser