Jenkins, InfluxDB and Grafana

Today an basic introduction to Jenkins, InfluxDB and Grafana. Docker is used to save some time. Okay,… let’s start.

Preparation

# create project and change directory
$ mkdir ~/Projects/JIG/influxdb && cd ~/Projects/JIG/

# download official jenkins image (latest)
$ docker pull jenkins

# download official influxdb image (latest)
$ docker pull influxdb

# download official grafana image (latest)
$ docker pull grafana/grafana

# list docker images
$ docker images
...
REPOSITORY          TAG                 IMAGE ID            CREATED             SIZE
jenkins             latest              59b08e8f6e37        4 days ago          704 MB
grafana/grafana     latest              2cdb407c0fa4        7 days ago          286 MB
influxdb            latest              fad81160f2de        13 days ago         224 MB
...

Jenkins preparation

# start Jenkins
$ docker run --name jenkins -p 8080:8080 jenkins

# copy password from cli
...
*************************************************************

Jenkins initial setup is required. An admin user has been created and a password generated.
Please use the following password to proceed to installation:

b49ffa5749724d61b43d3a159b181133
...

Now open your favorite browser with URL http://localhost:8080 and unlook Jenkins with following steps.
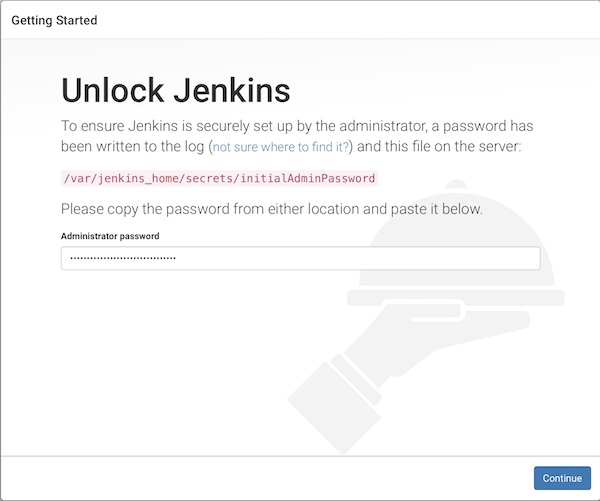
unlook jenkins

  1. unlook with password from cli
  2. install suggested plugins
  3. create your admin user
  4. start using jenkins

Next, the InfluxDB plug-in must be installed.

influxdb plugin jenkins

InfluxDB preparation

# start InfluxDB
$ docker run --name influxdb -p 8086:8086 -v $PWD/influxdb:/var/lib/influxdb influxdb

# check current configuration (optional)
$ docker exec -i influxdb influxd config

# create new user
$ curl -G http://localhost:8086/query --data-urlencode "q=CREATE USER jenkins WITH PASSWORD 'password123' WITH ALL PRIVILEGES"

# create database for jenkins
$ curl -G http://localhost:8086/query -u jenkins:password123 --data-urlencode "q=CREATE DATABASE jenkins_db"

# show users (optional)
$ curl -G http://localhost:8086/query -u jenkins:password123 --data-urlencode "q=SHOW USERS"
...
{"results":[{"statement_id":0,"series":[{"columns":["user","admin"],"values":[["jenkins",true]]}]}]}
...

# show databases (optional)
$ curl -G http://localhost:8086/query -u jenkins:password123 --data-urlencode "q=SHOW DATABASES"
...
{"results":[{"statement_id":0,"series":[{"name":"databases","columns":["name"],"values":[["_internal"],["jenkins_db"]]}]}]}
...

# show measurements
$ curl -G http://localhost:8086/query -u jenkins:password123 --data-urlencode "db=jenkins_db" --data-urlencode "q=SHOW MEASUREMENTS"
...
{"results":[{"statement_id":0}]}
...

Connect Jenkins with InfluxDB

# start jenkins container (if stopped)
$ docker start jenkins

# show ip of influxdb container
$ docker inspect --format '{{ .NetworkSettings.IPAddress }}' influxdb
...
172.17.0.2
...

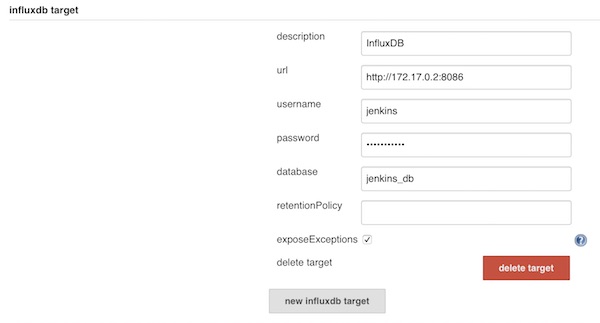
Add new InfluxDB target on Jenkins

jenkins influxdb settings

Save and create a new freestyle job. For example with following configuration.
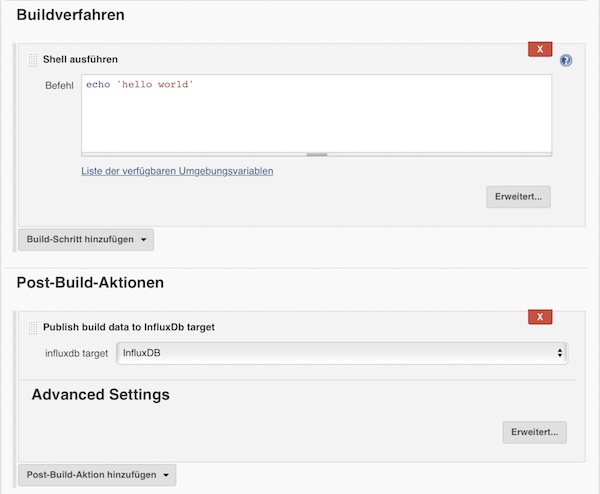
jenkins job influxdb

When you are done, run the job.

# show measurements
$ curl -G http://localhost:8086/query -u jenkins:password123 --data-urlencode "db=jenkins_db" --data-urlencode "q=SHOW MEASUREMENTS"
...
{"results":[{"statement_id":0,"series":[{"name":"measurements","columns":["name"],"values":[["jenkins_data"]]}]}]}
...

# run select statement (optional)
$ curl -G http://localhost:8086/query -u jenkins:password123 --data-urlencode "db=jenkins_db" --data-urlencode "q=SELECT * FROM jenkins_data"
...
{"results":[{"statement_id":0,"series":[{"name":"jenkins_data","columns":["time","build_number","build_result","build_result_ordinal","build_status_message","build_successful","build_time","last_stable_build","last_successful_build","project_build_health","project_name","project_name_1"],"values":[["2017-06-08T17:27:24.487Z",9,"SUCCESS",0,"stable",true,16,9,9,100,"test","test"]]}]}]}
...

Add Grafana

# start containers (if stopped)
$ docker start influxdb && docker start jenkins

# run grafana container
$ docker run --name grafana -i -p 3000:3000 grafana/grafana

Open you browser with URL http://localhost:3000, login with credentials (admin/admin) and add a new InfluxDB data source.
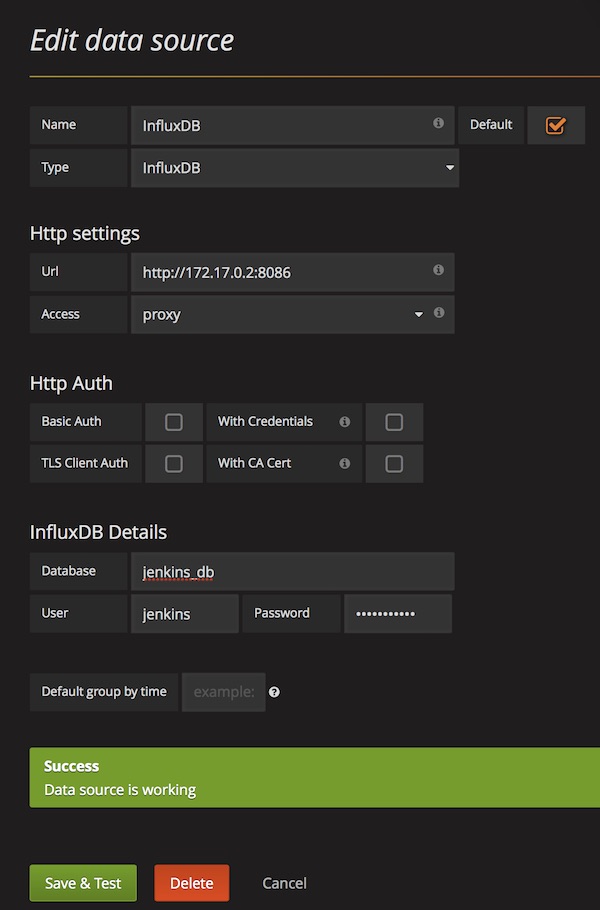
grafana data source

From now on, you can create and share dashboards in Grafana, which shows all Jenkins metrics.
Build a Docker Penetration Test environment

Today we build a penetration test environment via Docker. That means no Plug-Ins (for example: Java) are needed! If you are Mac OS X users, a VNC client is already included (since Yosemite).

Preparation:

# download all needed Docker images
$ docker pull owasp/zap2docker-stable
$ docker pull citizenstig/dvwa
$ docker pull jmbmxer/threadfix

# list local Docker images
$ docker images
...
REPOSITORY                TAG                 IMAGE ID            CREATED             SIZE
owasp/zap2docker-stable   latest              a774bdc65502        3 months ago        1.557 GB
jmbmxer/threadfix         latest              b6f1907a61cd        5 months ago        941 MB
citizenstig/dvwa          latest              c8312743bc09        23 months ago       478.5 MB

ZAP Attack Proxy

# run Docker container with ZAP Attack Proxy (insert and remember password)
$ docker run -u zap -p 5900:5900 -p 8080:8080 -v /tmp/reports:/home/zap/reports --name zap -i owasp/zap2docker-stable x11vnc --forever --usepw --create

# start VNC (Mac OS X)
$ open /System/Library/CoreServices/Applications/Screen\ Sharing.app/

…or use the short way via: [cmd] + [space] and type screen sharing

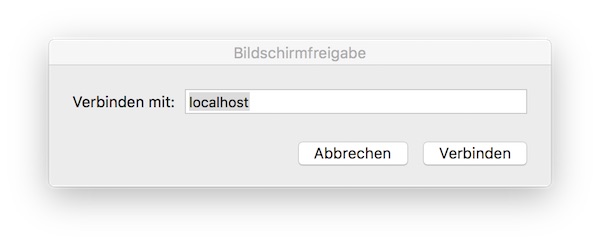
vnc connection to zap

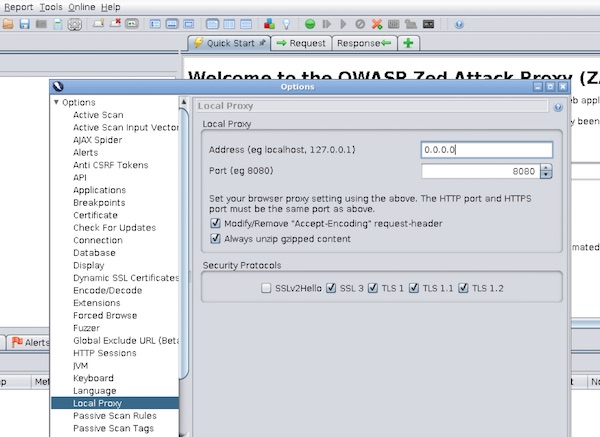
Insert “localhost” and your given password… and follow introduction for ZAP startup. Now you configure the ZAP Proxy Settings.

zap proxy configuration

Note: Select IP “0.0.0.0” for later use. You can also use “$ docker inspect zap” to find out the internal IP, but this could change on next start.

DVWA

# run Docker container with DVWA (2nd terminal)
$ docker run -d -p 8081:80 --name dvwa citizenstig/dvwa

# wait for startup
$ docker logs -f dvwa

# get host ip (from where you run browser)
$ ifconfig

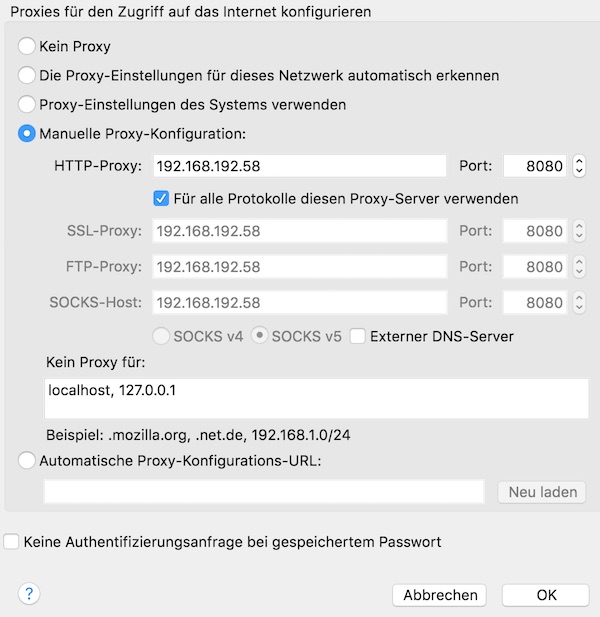
Now start your Firefox browser and change proxy settings. Insert your IP!

firefox proxy settings

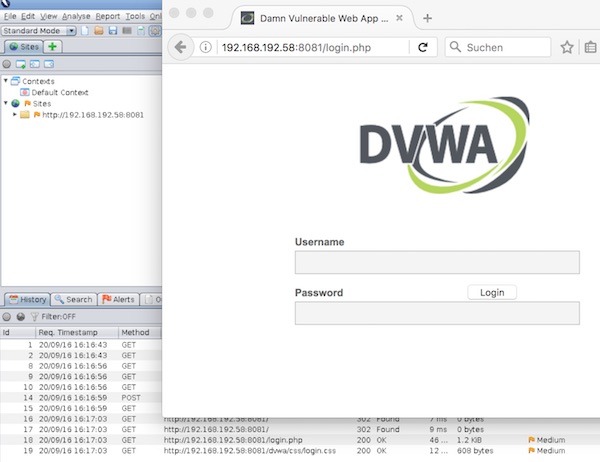
Call URL for DVWA in Firefox and run your penetration tests.

pentest firefox zap

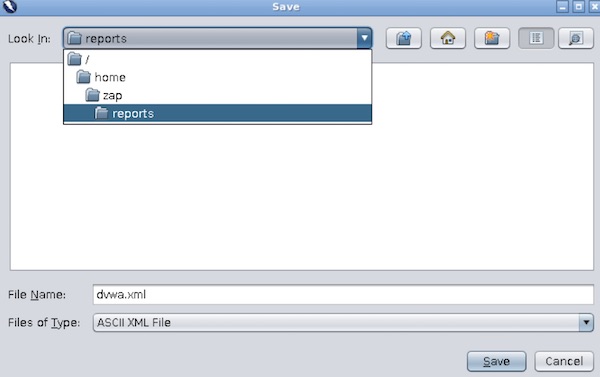
When you are done, export XML report

zap xml report
From now on, you can stop all running docker container.

ThreadFix

# run Docker container with ThreadFix
$ docker run -d -p 8443:8443 --name threadfix jmbmxer/threadfix start

# wait for startup
$ docker logs -f threadfix

Open Safari and call URL: https://localhost:8443/threadfix. Login with User: “user” and Password: “password”. Create a new team and add a application to team.

# open directory in finder
$ open /tmp/reports/

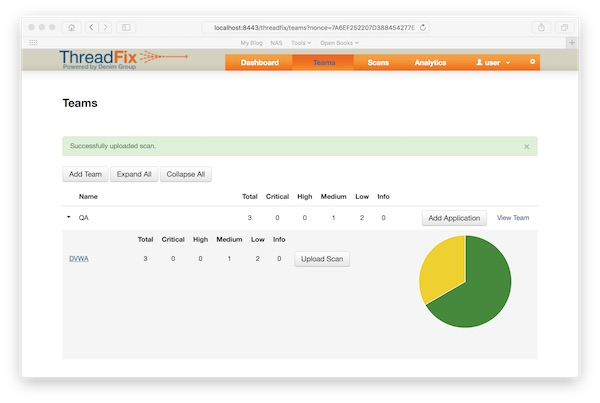
Import the ZAP XML report.

threadfix zap report

That is it… enjoy and expand your pentest laboratory!

Create own Docker port scanner

Today’s tutorial shows how quickly and easily a Docker port scanner can be created. With the knowledge you can then create additional Docker applications.

Preparation

# prepare knocker project (local)
$ mkdir ~/Projects/Knocker && cd ~/Projects/Knocker

# create Dockerfile (local)
$ vim Dockerfile

# create KnockerVM (local)
$ docker-machine create -d virtualbox KnockerVM

# pointing shell to KnockerVM (local)
$ eval $(docker-machine env KnockerVM)

# copy Dockerfile into KnockerVM (local)
$ docker-machine scp ~/Projects/Knocker/Dockerfile KnockerVM:Dockerfile

# SSH into KnockerVM (local)
$ docker-machine ssh KnockerVM

Dockerfile

FROM alpine

# install needed packages
RUN apk --update add wget build-base gcc abuild binutils binutils-doc gcc-doc

# download and unzip
RUN wget http://prdownloads.sourceforge.net/knocker/knocker-0.7.1.tar.gz
RUN tar -zxvf knocker-0.7.1.tar.gz && rm -f knocker-0.7.1.tar.gz

# configure, install and clean up
WORKDIR /knocker-0.7.1
RUN ./configure \
    && make install \
    && make clean

# create mountable directory
RUN mkdir /results
VOLUME /results
WORKDIR /results

# remove packages
RUN apk del wget build-base gcc abuild binutils binutils-doc gcc-doc \
    && rm -fr /knocker-0.7.1

ENTRYPOINT ["knocker"]

Usage

# build Docker image (KnockerVM)
$ docker build -t alpine/knocker .

# run Knocker help (KnockerVM)
$ docker run -ti --rm alpine/knocker --help

# run simple port scan (KnockerVM)
$ docker run -ti --rm alpine/knocker -H 192.168.192.1 -SP 1 -EP 10

# run port scan with (KnockerVM)
$ docker run -ti --rm -v /home/docker:/results alpine/knocker -H 192.168.192.1 -SP 80 -EP 90 -lf /results/report

# read report (KnockerVM)
$ cat report

Feel free to edit and/or expand! Knocker self can be found here.

Docker Audit

This tutorial shows software testers some simple examples for Docker audit. Here now we will make some audits on Docker environment and Dockerfiles.

Docker environment audit

# check Docker environment with docker-bench-security
$ docker run -it --net host --pid host --cap-add audit_control \
    -v /var/lib:/var/lib \
    -v /var/run/docker.sock:/var/run/docker.sock \
    -v /usr/lib/systemd:/usr/lib/systemd \
    -v /etc :/etc --label docker_bench_security \
    docker/docker-bench-security

Note: 1st the space after /etc is only because of security settings from my provider! 2nd create os specific docker-bench-security (example CentOS)

Dockerfile audit

# install on RedHat, CentOS, Fedora ...
$ yum install epel-release && yum install lynis

# install on Debian, Ubuntu ...
$ apt-get install lynis

# Suse
$ zypper install lynis

# install via Homebrew
$ brew install lynis

# audit Dockerfile
$ lynis audit dockerfile Dockerfile

# check log file
$ cat /var/log/lynis.log
$ cat /var/log/lynis-report.dat

Lint Dockerfile with Haskell Dockerfile Linter

# simply run Container again Dockerfile
$ docker run --rm -i lukasmartinelli/hadolint < Dockerfile

Visualisation of Docker and Kubernetes

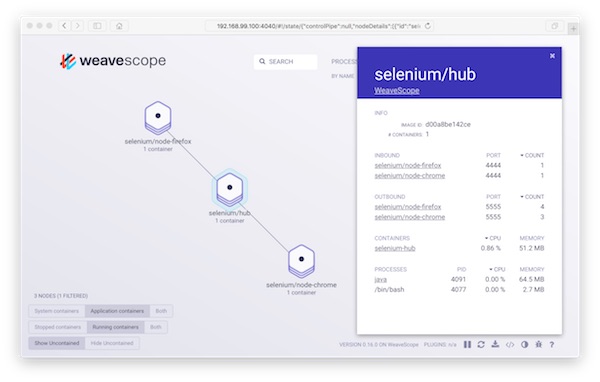
With Weave Scope you have in seconds a beautiful monitoring, visualisation & management for Docker and Kubernetes via your browser. I show with Docker-Selenium a simple example.

Preconditions

Lets go…

# create new Docker VM (local)
$ docker-machine create -d virtualbox WeaveScope

# pointing shell to WeaveScope VM (local)
$ eval $(docker-machine env WeaveScope)

# SSH into WeaveScope VM (local -> VM)
$ docker-machine ssh WeaveScope

# become root (VM)
$ sudo su -

# download scope (VM)
$ wget -O /usr/local/bin/scope https://git.io/scope

# change access rights of scope (VM)
$ chmod a+x /usr/local/bin/scope

# launch scope (VM)
# Do not forget the shown URL!!!
$ scope launch

# exit root and ssh (VM -> local)
$ exit

# create Selenium Hub (local)
$ docker run -d -p 4444:4444 --name selenium-hub selenium/hub:2.53.0

# create Selenium Chrome Node (local)
$ docker run -d --link selenium-hub:hub selenium/node-chrome:2.53.0

# create Selenium Firefox Node (local)
$ docker run -d --link selenium-hub:hub selenium/node-firefox:2.53.0

# show running containers (optional)
$ docker ps -a
...
CONTAINER ID        IMAGE                          COMMAND                  CREATED             STATUS              PORTS                    NAMES
a3e7b11c5a5f        selenium/node-firefox:2.53.0   "/opt/bin/entry_point"   9 seconds ago       Up 8 seconds                                 cocky_wing
699bf05681e8        selenium/node-chrome:2.53.0    "/opt/bin/entry_point"   42 seconds ago      Up 42 seconds                                distracted_darwin
bbc5f545261b        selenium/hub:2.53.0            "/opt/bin/entry_point"   2 minutes ago       Up 2 minutes        0.0.0.0:4444->4444/tcp   selenium-hub
9fe4e406fb50        weaveworks/scope:0.16.0        "/home/weave/entrypoi"   5 minutes ago       Up 5 minutes                                 weavescope

That’s it! Now start your browser and open the URL.

weavescope browser

Docker Remote API and CentOS 7

This time again some topics in one tutorial. We touch Vagrant with Shell provision (external script), Docker Remote API and something CentOS 7 configuration.

Preconditions

Preparation

If you already have a CentOS 7 with Docker, you can skip these steps. Create a folder with the following 2 files…

# -*- mode: ruby -*-
# vi: set ft=ruby :

Vagrant.require_version ">= 1.8.1"
VAGRANTFILE_API_VERSION = "2"

Vagrant.configure(VAGRANTFILE_API_VERSION) do |config|

  config.vm.define "centos" do |centos|
    centos.vm.box = "centos/7"
    centos.vm.network "public_network"
    centos.vm.synced_folder ".", "/vagrant", disabled: true

    centos.vm.provider "virtualbox" do |vb|
      vb.name = "Docker-Jenkins"
      vb.cpus = "2"
      vb.memory = "2048"
    end

    centos.vm.provision "shell", path: "provision.sh"
  end
end
#!/usr/bin/env bash

yum update -y && yum install -y epel-release vim

tee /etc /yum.repos.d/docker.repo <<-'EOF'
[dockerrepo]
name=Docker Repository
baseurl=https://yum.dockerproject.org/repo/main/centos/$releasever/
enabled=1
gpgcheck=1
gpgkey=https://yum.dockerproject.org/gpg
EOF

yum install -y docker-engine jq

systemctl enable docker
systemctl start docker

Instructions

# start VM via Vagrant
$ vagrant up

# SSH into VM via Vagrant
$ vagrant ssh

# check if API is enabled (optional)
$ docker -H=tcp://127.0.0.1:4243 images

Now we edit docker.service file. The path may be different!

# find docker.service file
$ systemctl status docker

# edit docker.service
$ vim /usr/lib/systemd/system/docker.service

...
[Service]
ExecStart=
ExecStart=/usr/bin/docker daemon -H fd:// -D -H tcp://127.0.0.1:4243
...

# reload and restart docker service
$ systemctl daemon-reload && systemctl restart docker

# test docker API again
$ docker -H=tcp://127.0.0.1:4243 version

Note: Be careful if you use tcp://0.0.0.0:4243 !!!!

# some tests with curl and jq on Docker Remote API
$ curl -X GET http://127.0.0.1:4243/version | jq .
$ curl -X GET http://127.0.0.1:4243/info | jq .DriverStatus
$ curl -X GET http://127.0.0.1:4243/networks | jq '.[0]'

Read the manual of jq, the power of curl and jq together is awesome.

Apache Jmeter and Docker

Okay, this time we will create a Docker-Jmeter test environment. We create some simple (but tiny) Docker images/containers which can be reused for future test runs. Here we follow the DRY rule. Next, we want to achieve.

$ java -jar apache-jmeter-3.0/bin/ApacheJMeter.jar -t /tutorial/jmx/simple.jmx -n -l /tutorial/results/log.jtl

Preconditions

Preparation

# create all directories
$ mkdir -p /tutorial/{java,jmeter,jmx,results}

# create Dockerfile for JAVA
$ cd /tutorial/java && vim Dockerfile

# build JAVA image
$ docker build -t alpine/java .

# create Dockerfile for Jmeter
$ cd /tutorial/jmeter && vim Dockerfile

# build Jmeter image
$ docker build -t alpine/jmeter .

# list Docker images (optional)
$ docker images
...
REPOSITORY          TAG                 IMAGE ID            CREATED             SIZE
alpine/jmeter       latest              0864228be6ef        15 seconds ago      150.2 MB
alpine/java         latest              068005f45866        5 minutes ago       102.8 MB
alpine              latest              f70c828098f5        5 days ago          4.795 MB

Dockerfile JAVA

FROM alpine

RUN apk --update add openjdk8-jre-base

ENTRYPOINT ["/usr/bin/java"]

Dockerfile Jmeter

FROM alpine

RUN apk --update add wget
RUN wget http://mirror.switch.ch/mirror/apache/dist//jmeter/binaries/apache-jmeter-3.0.tgz
RUN tar zxvf apache-jmeter-3.0.tgz
RUN apk del wget
RUN rm -f apache-jmeter-3.0.tgz
RUN rm -fr /apache-jmeter-3.0/docs

VOLUME /apache-jmeter-3.0

CMD ["/bin/true"]

JMX file

Create or copy existing JMX file on folder “/tutorial/jmx” with name “simple.jmx”.

# show JMX (optional)
$ ls /tutorial/jmx
...
simple.jmx

Create Jmeter container

# create jmeter container
$ docker create --name jmeter alpine/jmeter

# list containers (optional)
$ docker ps -a
...
CONTAINER ID        IMAGE               COMMAND             CREATED             STATUS      PORTS       NAMES
0916ff8f25bb        alpine/jmeter       "/bin/true"         7 seconds ago       Created                 jmeter

Note: The container was created but not running!

Test execution

# test run JAVA container (optional)
$ docker run -ti --rm --volumes-from jmeter alpine/java -jar /apache-jmeter-3.0/bin/ApacheJMeter.jar --version

# run Jmeter (without report)
$ docker run -ti --rm -v /tutorial/jmx:/jmx --volumes-from jmeter alpine/java -jar /apache-jmeter-3.0/bin/ApacheJMeter.jar -t /jmx/simple.jmx -n

# run Jmeter (with report)
$ docker run -ti --rm -v /tutorial/jmx:/jmx -v /tutorial/results:/results --volumes-from jmeter alpine/java -jar /apache-jmeter-3.0/bin/ApacheJMeter.jar -t /jmx/simple.jmx -n -l /results/log.jtl

# show report
$ cat /tutorial/results/log.jtl

🙂

dnstwist with docker

What happens when users make a typo in URL input? It can display a fake websites. This similar-looking domains can be used to attack you (Domain Name Permutation). With dnstwist you can find such “evil neighbors”. This tutorial shows how to use in a few seconds dnstwist.

Precondition

  • docker installed and running
  • docker-machine installed (optional)

Instructions

# create VM (optional)
$ docker-machine create -d virtualbox dnstwist

# pointing shell (optional)
$ eval $(docker-machine env dnstwist)

# download docker image (optional)
$ docker pull jrottenberg/dnstwist

# start dnstwist
$ docker run --rm jrottenberg/dnstwist bitbucket.org