Understand and measure signal strength with Wifi Pineapple

It’s a long title for a tutorial this time. Don’t worry I will try my best to make it short and understandable. Many people wonder why there penetration of Wifi networks not really works and forget about an very important point: “Wifi Signal Strength”. But what is it? How can I measure it? Do I need to buy expensive software? Here a try to enlighten you. For this explanation I will use the Wifi Pineapple device with some command line tools and a nice UI module.

Objectiv

Understand the basics of Wifi Signal Strength and learn how to measure it.

Precondition

Wifi Pineapple device incl. SSH connection into it plus internet connection (to download the module).

The basics

The WiFi signal strength is given as the logarithmic (not linear) unit of measurement of the power dBm. Decibels are relative to milliwatts and are expressed as a negative number from 0 to -100. For example, a signal value of -50 is much stronger than a signal value of -70. A difference of 3 dBm is therefore halving or doubling the strength of the previous value. The following table should give some information about the values.

Signal strengthQualityDescription
-30 dBmExcellentOne of the best values ​​that can be achieved.
-50 dBmGoodAn very good signal level which allows all applications in the network.
-70 dBmAcceptableNot a good value, there are already severe application problems.
-90 dBmVery badVery bad value, there is usually no connection here.

The measurement

Now let’s get to the measurement quickly. Start the Wifi Pineapple and connect.

# SSH into Wifi Pineapple device
$ ssh root@192.168.2.10

Let’s take a look at the values ​​of the wifi devices themselves (these will be different).

# show statistics on each wireless interface in the system
$ cat /proc/net/wireless

# show interface configuration with ifconfig
$ ifconfig wlan0
$ ifconfig wlan1

# show interface configuration with iwconfig
$ iwconfig wlan0
$ iwconfig wlan1

Now we scan the Wifi’s and have the values ​​displayed (repeat this multiple times to get the average).

# use iwlist to scan (old way)
$ iwlist wlan0 scanning | egrep -i 'SSID|Quality'

# use iw to scan (modern way)
$ iw wlan0 scan | egrep -i 'SSID|signal'

Make it more visible

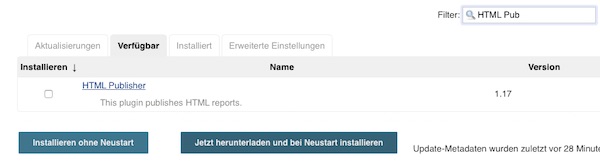
Under the Wifi Pineapple modules you can search for “SignalStrength” and install it. After successful installation, select the module then select one of your available wifi interfaces and press button “Scan”.

Wifi Pineapple module SignalStrength scan

After short time you will have outputs as table and graph.

Signal Level Graph

That’s it already. With these basics, you should be able to understand and perform your wifi penetration tests even better.

Wifi Pineapple Module DWall

This is the first tutorial about Wifi Pineapple modules. I will start with a simple one called DWall. With this module you can gather and display easily live informations from connected clients wich using the HTTP protocol.

Objective

Installation and usage of module DWall on the Wifi Pineapple.

Precondition

Your Wifi Pineapple need to have an internet connection.

Installation

This time we will use the browser UI for the installation. Let’s start… Look for DWall among the available modules, click the “Install” button and select the location (you should always select the SD card, if available).

DWall installation on Wifi Pineapple

Via Terminal you can verify the installation, too.

# list installed modules on sdcard folder
$ ssh root@192.168.2.10 -C 'ls -la /sd/modules/'

Usage

After successful installation (which should be quite fast), select the module. Now activate it and start the listener. As soon as a connected client makes requests with HTTP, you will see them in the module output. Depending on the responce, also other data such as pictures.

DWall report on Wifi Pineapple UI

Now the last one should also understand why encryption (HTTPS) is so important! Even if it is already used a lot, you will figure that many websites still work without encryption.

Getting started with Metasploit

Many tutorials about Metasploit are available on internet (as well many books and trainings), but most of them confusing beginners. My intention with the following content is to create a simple environment (via Docker) and to show the use of this. In order not to make it too boring, I also show some important basics for Metasploit itself.

Objective

Learn how to create and use a simple training environment as well as learn first basic metasploit commands.

Precondition

Docker (latest) installed

Prepare environment

As mentioned already we will use Docker. The benefits here are this does not need installations and no local installed Anti-virus tool does disturb and complain.

# create working directory and change location
$ mkdir -p ~/Projects/Metasploit/msf && cd ~/Projects/Metasploit

# list directories/files (optional)
$ tree .
|__msf

# create network
$ docker network create --subnet=172.18.0.0/16 metasploit

# check created network (optional)
$ docker network ls --filter driver=bridge --no-trunc

# run postgres container
$ docker run -d --name postgres --ip 172.18.0.2 --network metasploit -e POSTGRES_PASSWORD=postgres -e POSTGRES_USER=postgres -e POSTGRES_DB=msf -v "$(pwd)/msf/database:/var/lib/postgresql/data" postgres:11-alpine

# show logs (optional)
$ docker logs postgres

# run metasploit container
$ docker run --name metasploit --ip 172.18.0.3 --network metasploit -it -v "$(pwd)/msf/user:/home/msf/.msf4" -p 8443-8500:8443-8500 metasploitframework/metasploit-framework ./msfconsole

# list latest created containers (optional in different tty)
$ docker ps -n 2

Connect database

In this environment we need to connect the Postgres database manually.

# check database status (optional)
msf5 > db_status

# connect (if broken)
msf5 > db_connect postgres:postgres@172.18.0.2:5432/msf

Prepare Metasploit workspace

This is an very important step! It gets often forgotten in other tutorials. Without this steps you will have later many problems/confusions and may don’t understand why.

# list all workspaces
msf5 > workspace

# create new workspace
msf5 > workspace -a hackthissite.org

# list all hosts (optional)
msf5 > hosts

# list all services (optional)
msf5 > services

Some scanner actions

As promised here some other basics.

# search for scanner with name:tcp
msf5 > search auxiliary name:tcp

# select tcp portscanner module
msf5 > use auxiliary/scanner/portscan/tcp

# show detailed information (optional)
msf5 auxiliary(scanner/portscan/tcp) > info

# show options
msf5 auxiliary(scanner/portscan/tcp) > options

# set needed values
msf5 auxiliary(scanner/portscan/tcp) > set RHOSTS hackthissite.org
msf5 auxiliary(scanner/portscan/tcp) > set PORTS 20-100
msf5 auxiliary(scanner/portscan/tcp) > set THREADS 6

# execute scan
msf5 auxiliary(scanner/portscan/tcp) > run

# move out of the current context
msf5 auxiliary(scanner/portscan/tcp) > back

# list all hosts
msf5 > hosts

# list all services
msf5 > services

Stop and restart the environment

# stop metasploit container
msf5 > exit

# stop postgres container
$ docker stop postgres

# check container status (optional)
$ docker ps -a
# change directory (if not done already)
$ cd ~/Projects/Metasploit

# start postgres container (first)
$ docker start postgres

# start metasploit container
$ docker start metasploit

# run msfconsole (without banner)
$ docker exec -ti metasploit ./msfconsole -q

# connect to postgres (if broken)
msf5 > db_connect postgres:postgres@172.18.0.2:5432/msf
Connected to Postgres data service: 172.18.0.2/msf

# list workspaces
msf5 > workspace
  hackthissite.org
* default

# select specific workspace
msf5 > workspace 'hackthissite.org'
[*] Workspace: hackthissite.org

Now you have everything you need for the next tutorials.

HTTPS and Wireshark

Using the two browsers (Firefox and Chrome), I’ll show you how to analyze the TLS traffic with Wireshark. If you only want to use one of the browsers, you can, of course.

What you need?

  • Wireshark (latest version)
  • Google Chrome (latest version)
  • Firefox (latest version)

Let’s start

After export do not change or restart you terminal. Or set an environmental variable (global/user specific) for example in .bashrc/.bash_profile/etc. file.

# create empty file
$ touch ~/Desktop/keys.log

# create environment variable
$ export SSLKEYLOGFILE=$HOME/Desktop/keys.log

# start Firefox
$ /Applications/Firefox.app/Contents/MacOS/firefox-bin --ssl-key-log-file=$HOME/Desktop/keys.log

# start Chrome
$ /Applications/Google\ Chrome.app/Contents/MacOS/Google\ Chrome --ssl-key-log-file=$HOME/Desktop/keys.log

In another terminal, you can watch the file.

# tail file (optional)
$ tail -f ~/Desktop/keys.log
...
CLIENT_RANDOM
33da89e4b6d87d25956fd8e8c1e6965575e379ca263b145c8c1240c7f76b0d2a
348d23440ef23807a88c9bda8c8e5826316b15bba33bbfe776120fb9d711c1b04dcf8
1e99e4a58e9d0c57ac955f12a7
...

Wireshark and open Preferences -> Protocols -> SSL. Browse here for file “$HOME/Desktop/keys.log” and confirm your settings.

Wireshark SSL Settings

Start your record (may with filters) and open URL in browser. For example, you can now view the data in Wireshark via the “Decrypted SSL data” tab.

Jenkins and Sitespeed.io

While surfing the internet I stumbled across Sitespeed.io. It’s a amazing collection of Open Source Tools, which make performance measuring for developers and testers super easy. I tried it out and was immediately impressed. Here’s a little tutorial on how to use Jenkins and Sitespeed.

Requirements

Docker (latest)

Environment setup

With minimal 2 commands the environment (via Docker) is already created. Most of the time will be needed for the plugins installation.

# create Project
$ mkdir -p ~/Projects/Sitespeed/target && cd ~/Projects/Sitespeed

# pull latest sitespeed image (optional)
$ docker pull sitespeedio/sitespeed.io:latest

# start Jenkins container
$ docker run -e JAVA_OPTS="-Dhudson.model.DirectoryBrowserSupport.CSP=\"sandbox allow-scripts; style-src 'unsafe-inline' *;script-src 'unsafe-inline' *;\"" --name jenkins -v $(pwd)/target:/var/jenkins_home -v /var/run/docker.sock:/var/run/docker.sock -v $(which docker):$(which docker) -p 8080:8080 -p 9000:9000 jenkins/jenkins:lts

# open Jenkins in browser (be patient)
$ open http://localhost:8080

On setup wizard finish: unlock Jenkins, install the suggested plugins, create an account and finish the instance configuration.

Jenkins permissions to /var/run/docker.sock

Before you start with Jenkins job configuration, ensure that user jenkins has permissions to /var/run/docker.sock.

# test permissions
$ docker exec -ti jenkins docker info Got permission denied...

# create group docker
$ docker exec -ti -u 0 jenkins groupadd -for -g 0 docker

# add jenkins to group
$ docker exec -ti -u 0 jenkins usermod -aG docker jenkins

# restart jenkins container
$ docker restart jenkins

Jenkins job configuration

When Jenkins is ready (restarted), install the HTML Publisher PlugIn (no restart after installation of plugin required).

Jenkins HTML Publisher Plugin

Create a new free-style project named SiteSpeed.

Jenkins SiteSpeed Project

Attention: You need to specify later the absolute path to the local directory /target/workspace/SiteSpeed. If you do not know how, press save and start the build without any job information (empty job configuration) and follow the optional instructions.

# change directory (optional)
$ cd ~/Projects/Sitespeed/target/workspace/SiteSpeed

# get absolute path (optional)
$ pwd

In my case the path is: “/Users/steffen/Projects/Sitespeed/target/workspace/SiteSpeed”. Under job configuration section “Build” enable “Execute shell” and paste following command.

docker run --rm --shm-size=1g -v /Users/steffen/Projects/Sitespeed/target/workspace/SiteSpeed:/sitespeed.io sitespeedio/sitespeed.io --visualMetrics --video --outputFolder output https://www.sitespeed.io/ -n 1

Via Post-Build-Action: Publish HTML reports you can enter the report very simple from the job project page.

Jenkins SiteSpeed Job Configuration

Save everything and run the job. After a short time you can look at the HTML report. See “Pages” > “https://www.sitespeed.io/” for screenshots, HAR and video files. On the website of sitespeed.io is a very detailed documentation and many more examples. Have fun!

Show NAT type and external IP

PyStun is an nice Python STUN client which will help you to detect your NAT type and your external IP address. Here now a simple tutorial for usage.

Requirements

  • min. Python 2.7.x installed
  • Python virtualenv installed

Preparation

# create project and change directory
$ mkdir -p Projects/NAT && cd Projects/NAT

# create virtualenv and activate it
$ virtualenv .env && . .env/bin/activate

# install pystun
$ pip install pystun

# check pystun version (optional)
$ pystun --version

Run pystun

# run pystun with STUN host and STUN port
$ pystun -H stun.12connect.com -P 3478
NAT Type: Restric NAT
External IP: 178.81.75.18
External Port: 54320

# run pystun with STUN host and STUN port
$ pystun -H stun4.l.google.com -P 19302
NAT Type: Full Cone
External IP: 178.81.75.18
External Port: 54320

NAT Variations

On ietf.org you will find very detailed documentation on STUN.

Wifi Monitor Mode Basics

There are several ways to enable monitor mode for Wifi interfaces. Depending to your OS, installed packages, installed drivers and the Wifi model these methods are available and/or useful. In this tutorial I will explain three different ways.

3 different ways

The first example enables the monitor mode via iwconfig. To start/stop the interface the ip command is used, but you could also use ifconfig command.

# disable interface
$ ip link set wlan0 down

# enable monitor mode
$ iwconfig wlan0 mode monitor

# check interface status (optional)
$ iwconfig wlan0 | grep -i mode | awk '{print $4}'

# enable device
$ ip link set wlan0 up

The second example enables monitor mode via airmon-ng. The explicit start or stop of the interface is not necessary here. Attention, this method will change the name of the interface.

# stop interfering processes
$ airmon-ng check kill

# enable monitor mode
$ airmon-ng start wlan0

# check interface status (optional)
$ iwconfig wlan0mon | grep -i mode | awk '{print $4}'

The third example enables monitor mode via iw. To start/stop the interface the ifconfig command is used, but you could also use ip command.

# disable interface
$ ifconfig wlan0 down

# enable monitor mode
$ iw wlan0 set monitor control

# check interface status (optional)
$ iw dev | grep -i type | awk '{print $2}'

# enable device
$ ifconfig wlan0 up

It may happen that your interface crashes during the scan. In that case, you should choose a different method. If none of the shown examples works properly, it could be due to the Network Manager. In this case, turn it off. Attention, this action is then valid for all interfaces and can disturb your internet connection.

# stop network manager
$ systemctl stop NetworkManager

Pimp my Kubernetes WebUI

There is a very easy way to pimp the Kubernetes WebUI with monitoring output. The whole thing we now realize super fast via Heapster, InfluxDB and Grafana.

Conditions

  • Installed and running Docker for Mac (edge)
  • Kubernetes enabled

Preparation

# list all pods
$ kubectl get pods --all-namespaces
...
NAMESPACE     NAME                                         READY     STATUS    RESTARTS   AGE
kube-system   kubernetes-dashboard-5bd6f767c7-f9w4j        1/1       Running   1          17d
...

# create port forward
$ kubectl port-forward kubernetes-dashboard-5bd6f767c7-f9w4j 8443:8443 --namespace=kube-system

# open WebUI in browser
$ open https://localhost:8443

# get token
$ kubectl -n kube-system get secret | grep deployment-controller-token
...
deployment-controller-token-s4xdg                kubernetes.io/service-account-token   3         17d
...

# show token
$ kubectl -n kube-system describe secret deployment-controller-token-s4xdg
...
token: XXXX
...

Now login to the WebUI with the token.

WebUI Token Login

Enable Monitoring

Download all 3 files from GitHub kubernetes/Heapster into your project. After download we need to modify a little bit and create deployment + service.

# edit heapster.yml
$ vim heapster.yml

# edit grafana.yml
$ vim grafana.yml

# edit influxdb.yml
$ vim influxdb.yml

Attention: The respective sections Services have to be adapted!
… But leave the rest of the content as is.

...
---
apiVersion: v1
kind: Service
metadata:
  labels:
    task: monitoring
    kubernetes.io/name: Heapster
  name: heapster
  namespace: kube-system
spec:
  ports:
  - port: 80
    targetPort: 8082
  selector:
    k8s-app: heapster
...
---
apiVersion: v1
kind: Service
metadata:
  labels:
    task: monitoring
    kubernetes.io/name: monitoring-influxdb
  name: monitoring-influxdb
  namespace: kube-system
spec:
  ports:
  - port: 8086
    targetPort: 8086
  selector:
    k8s-app: influxdb
...
---
apiVersion: v1
kind: Service
metadata:
  labels:
    kubernetes.io/name: monitoring-grafana
  name: monitoring-grafana
  namespace: kube-system
spec:
  type: NodePort
  ports:
  - port: 80
    targetPort: 3000
  selector:
    k8s-app: grafana
# create resources from files
$ kubectl create -f heapster.yml
$ kubectl create -f influxdb.yml
$ kubectl create -f grafana.yml

That’s it already – our monitoring is enabled! Let’s take a look at everything.

# list all services (optional)
$ kubectl get services --all-namespaces

# show details of monitoring-grafana (NodePort)
$ kubectl describe services monitoring-grafana --namespace kube-system

# open Grafana in browser
$ open http://localhost:30703

Grafana Dashboards

Grafana Cluster Dashboard

Grafana Pod Dashboard

WebUI Dashboards

After a while it should look like this.

WebUI Workloads

WebUI Pods