Before we start, if you don`t know what is profiling read this Wikipedia article! In my opinion profiling should be a part of every development/build process! Whether the responsibility lies with QA or development. Python profiler are supported only in PyCharm Professional Edition. This article show you the possibilities for the community edition.
Preparation
- PyCharm installed
- Virtualenv or similar installed (optional)
- PyCharm BashSupport Plugin installed
The easiest Profiler
With Unix/Linux time command you have allready a simple profiler! Time writes a message to standard output. Here you will find some information on Stackoverflow.
#!/usr/bin/env python
# -*- coding: utf-8 -*-


def hello_world():

    for i in range(1, 5):
        print '%d Hello world from python...' % i


if __name__ == '__main__':
    hello_world()
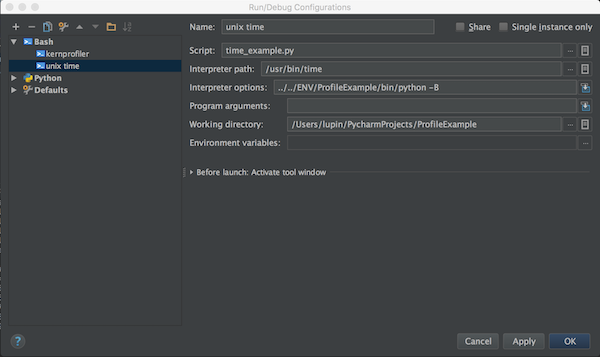
With BashSupport Plugin we can setup the “Run/Debug Configuration” like:

Better informations
But now we need better information. For this we use cProfile, cprofilev and snakeviz.
# cProfile is part of standard python library

# install snakeviz
$ pip install snakeviz

# install cprofildev
$ pip install cprofilev
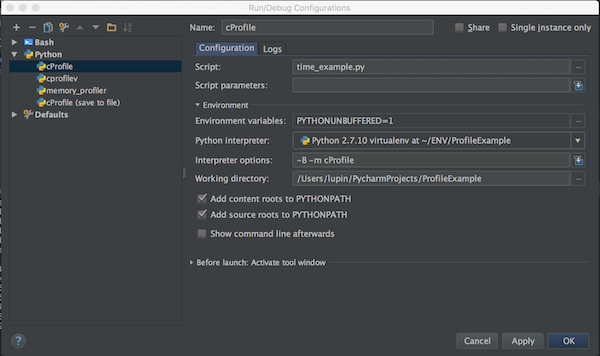
“Run/Debug Configuration” example

Now will store the results into a file

With snakeviz you can open the profile in browser:
$ snakeviz output.prof
The other option is to use cprofilev:

Even more information
If that was not enough,… we install some more libraries.
# install line_profiler
$ pip install line_profiler

# install memory_profiler and psutil
$ pip install memory_profiler
$ pip install psutil
Now we need to change the example code. We add the decorator…
#!/usr/bin/env python
# -*- coding: utf-8 -*-


@profile
def hello_world():

    for i in range(1, 5):
        print '%d Hello world from python...' % i


if __name__ == '__main__':
    hello_world()
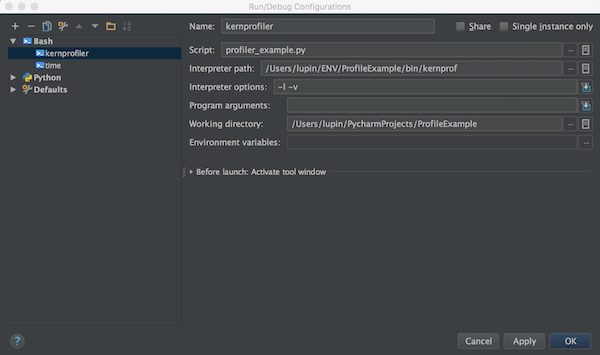
the line_profiler configuration

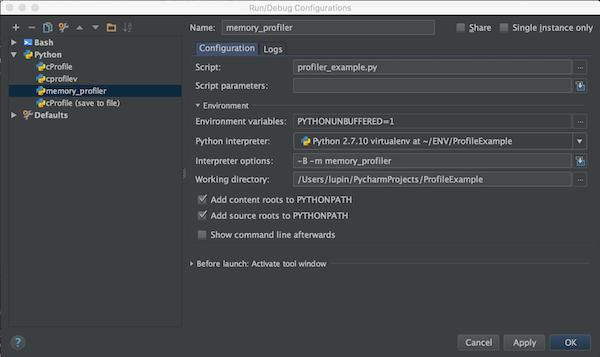
the memory_profiler

All configurations could now startet via the “Run” button. There are even more Profiler that you can use with similar PyCharm.