Dynamic data for JMeter

Preparation

JAVA and JMeter are already installed.

Steps

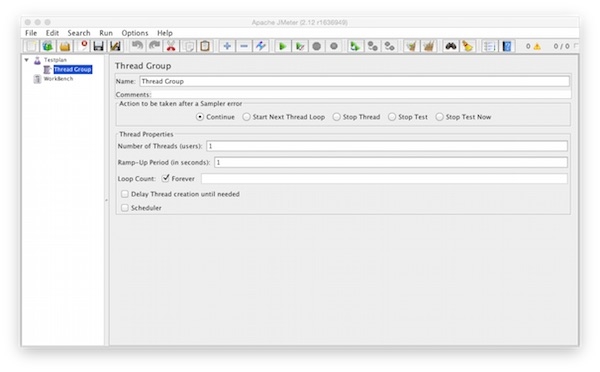
Create new “Test Plan” and add one “Thread Group” (Threads (Users)).

  • Number of Threads: 1
  • Ramp-Up Period: 1
  • Loop Count Forever: checked
meter thread group

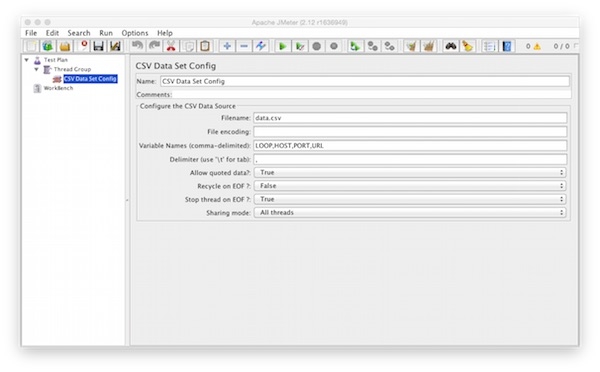
Add to the “Thread Group” one “CSV Data Set Config” (Config Element).

  • Filename: Path to your CSV file
  • Variable Names: LOOP,HOST,PORT,URL
  • Delimiter: ,
  • Allow quoted data: true
  • Recycle on EOF: false
  • Stop thread on EOF: true
jmeter csv data set config

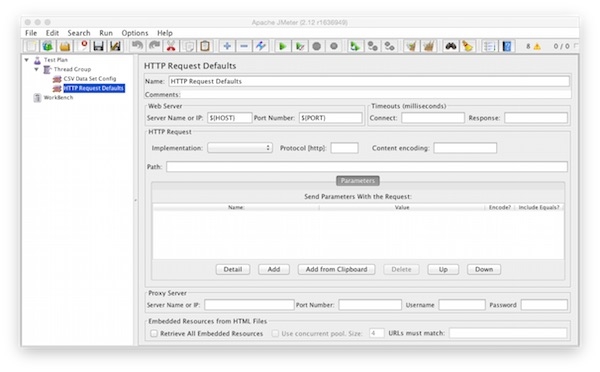
Add to the “Thread Group” one “HTTP Request Defaults” (Config Element).

  • Server Name or IP: ${HOST}
  • Port Number: ${PORT}
jmeter http request defaults

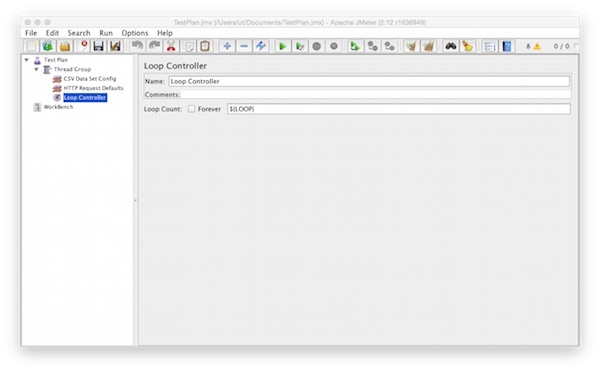
Add to the “Thread Group” one “Loop Controller” (Logic Controller).

  • Loop Count: ${LOOP}
  • Forever: not checked
jmeter loop controller

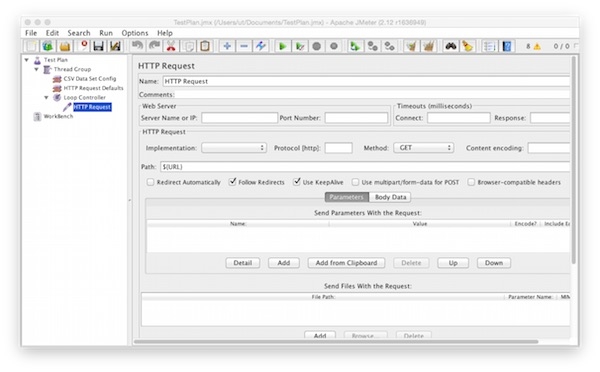
Add to the “Loop Controller” one “HTTP Request” (Sampler).

  • Method: GET
  • Path: ${URL}
  • Follow Redirects: checked
  • Use KeepAlive: checked
jmeter http request

Add to the “Thread Group” one “View Results Tree” (Listener).
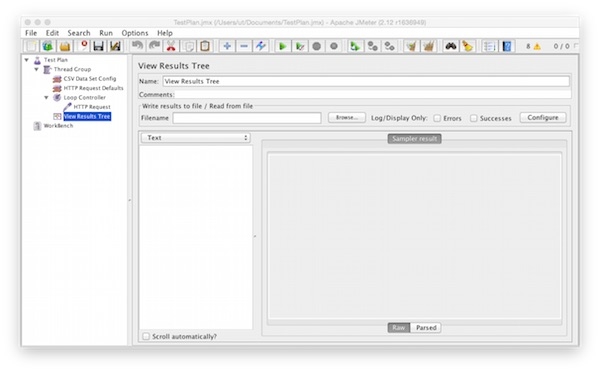
meter view result tree

Rename the “HTTP Request” into “${HOST}:${PORT}${URL}”.

jmeter http request extension

Create the CSV file with some comma separated values (LOOP,HOST,PORT,URL).

jmeter csv

Run

Save the test plan as JMX file and run the test plan.
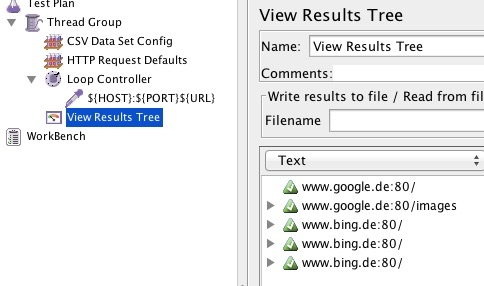
jmeter result

Embed SLOCCount into Jenkins jobs

Preparation

Install SLOCCount and cloc on system.

$ aptitude install sloccount cloc

Search and install the “SLOCCount Plugin”.

jenkins sloccount plugin
Search SLOCCount Plugin

Configure

Now search your job and start configuration and insert the command “Build > Execute Shell”.

sloccount --duplicates --wide --details ${WORKSPACE}/<file|folder> > sloccount_report.sc

As last step add the Post-Build-Action – “View SLOCCount results” and insert the generated report “sloccount_report.sc”.

sloccount result path
Configure Post-Build-Action

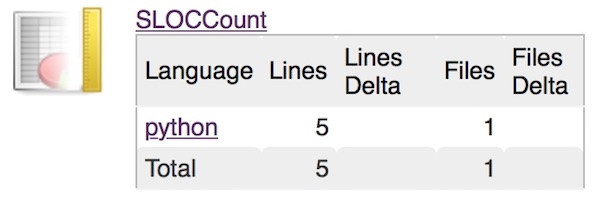
The plugin just show the number of lines per file, file type and folder. No estimated project value or other informations! This information you can see direct on generated report. After running the build, your screen should look similar like this:

sloccount report
SLOCCount report

Markup validation with Jenkins

Preparation

Search and install the “Unicorn Validation Plugin” and “Plot Plugin”

jenkins unicorn plugin
Search for Plugin

Configure

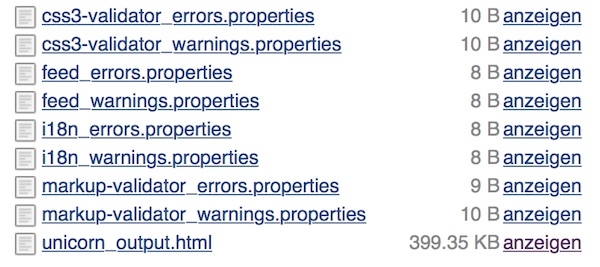
Within the build section, add a build step “Unicorn Validator”. For the Site to validate add a URL to a site that you want to test. Before you configure the Post-build Actions you should save and run. After 1st run the workspace should look similar.

unicorn results
Workspace files

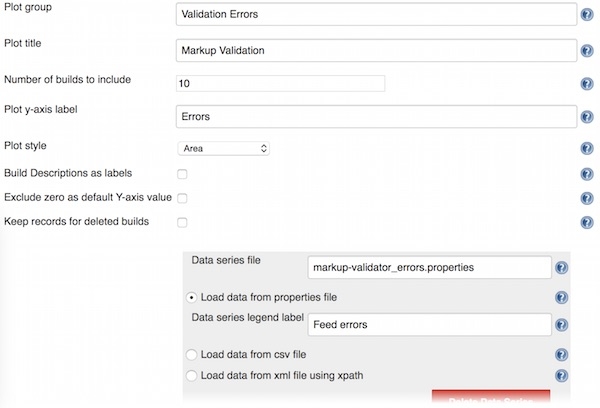
Now start configuration again. On Post-build Actions section add “Plot build data”, and add the following details:

unicorn configuration
Plot configuration

Now you can run the build again and on job navigation you see the item “Plots”. Repeat the last step for plotting of css results. As value for “Plot title” use “CSS Validation errors” and for “Data series file” use “css3-validator_errors.properties”.

Agile view for Jenkins

Preparation

Search and install the “Radiator View” plugin.

radiator plugin jenkins
Select Radiator View Plugin

Configuration

After installation create a new view, similar to configuring the more conventional list views.

radiator view jenkins
Select Radiator view

Now select all desired jobs and press “Save” button.

radiator agil view
Agile view

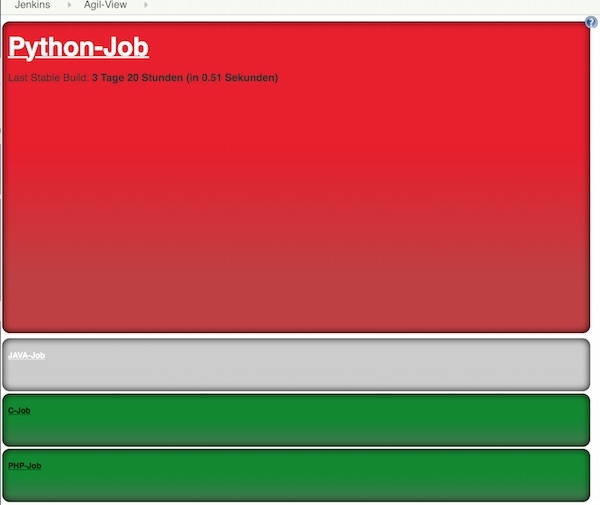
The build radiator view displays a box for each build with the job name and some other details, depending on build steps and test methods.

Simple python job on Jenkins

In this tutorial i show, how you as a tester can create a very basic python code analysis and documentation job in your build server.

Preparation

Install needed python modules

$ pip install pylint
$ pip install pep8
$ pip install epydoc

Install needed Jenkins plugins

  • HTML Publisher Plugin
  • Violations

Create a Free Style job

Create a new job with your requirements (e.g. Project name, Source-Code Management, etc.). Now insert commands “Build > Execute Shell”.

pep8 ${WORKSPACE}/<module|file> > pep8_report.txt

echo "pep8 complete"

pylint -f parseable ${WORKSPACE}/<module|file> | tee pylint_report.txt

echo "pylint complete"

[ -d ${WORKSPACE}/API ] && rm -fr ${WORKSPACE}/API

epydoc ${WORKSPACE}/<module|file> --html --name 'My Project API' -o ${WORKSPACE}/API/

echo "epydoc complete"

Add the Post-Build-Action – Report Violations and Publish HTML reports. On violations insert the pep8 (pep8_report.txt) and pylint (pylint_report.txt) values. On Publish HTML reports add the folder API.

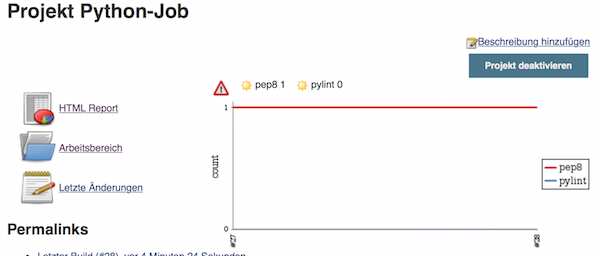
After running the build, the screen should look like this:

Jenkins Python Report