Something awesome for your Docker pipelines

While my constant research for pipeline tools, I have found a fantastic security scanner for Docker images. Something you could use quickly under the topic of CI/CD and DevSecOps for your development. It’s named anchore/grype and the best it’s Open source, really fast and delivers many nice options for reports.

Requirements

  • Docker installed (to pull images)

Hint: You also can load and scan *.tar archives.

Objective

Short introduction in installation and usage of Grype (locally to evaluate).

Note: The later integration into your pipelines shouldn’t be a problem. I will add the Grype repository to my watchlist and for sure try it out in my pipelines.

Installation and default configuration

This first step should only take a few minutes.

# install the latest version to /usr/local/bin
$ curl -sSfL https://raw.githubusercontent.com/anchore/grype/main/install.sh | sh -s -- -b /usr/local/bin

# install the latest version to ~/Downloads
$ curl -sSfL https://raw.githubusercontent.com/anchore/grype/main/install.sh | sh -s -- -b ~/Downloads

# move binary to /usr/local/bin/grype (if you define different location)
$ mv ~/Downloads/grype /usr/local/bin/grype

# create configuration file
$ vim ~/.grype.yaml

# show help
$ grype --help

I copied the content in short form from the official GitHub repository. You can adapt this to your needs at any time.

check-for-app-update: true
fail-on-severity: ''
output: "table"
scope: "squashed"
quiet: false
db:
  auto-update: true
  cache-dir: "~/.grype/db"
  update-url: "https://toolbox-data.anchore.io/grype/databases/listing.json"
log:
  file: ""
  level: "error"
  structured: false

Prepare the database

The Anchore Feed Service provides regular updates about publicly available vulnerabilities. In this section I will guide you to derive the updates manually.

# check database status (optional)
$ grype db status

# check feed service for new updates
$ grype db check

# run database update
$ grype db update

# verify db files (optional)
$ ls -la ~/.grype/db/

Usage examples

Even as the usage of Grype is very simple, here some short examples.

# scan image with configuration settings
$ grype node

# scans for vulnerabilities on all image layer and set output format
$ grype --scope all-layers -o cyclonedx node

# stop if a severity high is found with exit code 1
$ grype --fail-on high node

# show last exit status (optional)
$ echo $?

To stop your validation/pipeline on certain severities of security risks (exit code 1), you can choose between following options: negligible, low, medium, high & critical.

Hint: To save the reports you could use the redirect, to the output stream to a file.

Clean up

Don’t forget to clean up your system!

# list all Docker images (optional)
$ docker images

# delete specific Docker image by name
$ docker rmi node
Nessus on AWS

Nessus is a vulnerability scanner from Tenable. In this tutorial I will show how you can install Nessus on AWS (Debian), how you connect your local browser and perform a simple network scan. You need only a AWS account (eq Free Tier), SSH and a web browser.

Note: Please have a look on that page about pentesting on AWS first.

Create new EC2 instance

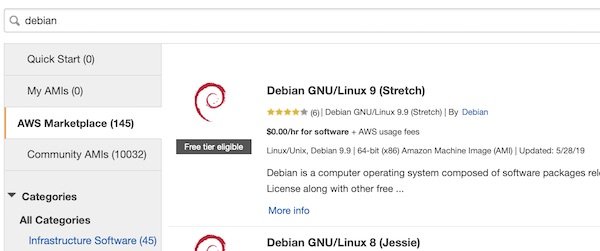
Login into your AWS console (or use AWSCLI), create a new SecurityGroup with SSH port 22 only (inbound) and launch a new instance. Search for “Debian”…

AWS EC2 Debian 9
Debian 9 on AWS Maretplace

Press button “Select” and finish all needed following steps (save your keys). After your EC2 instance is ready check for IP or DNS and connect.

# connect via SSH to EC2 instance
$ ssh -i ~/.ssh/ admin@<instance>

# compile a list of locale definition files (optional)
$ sudo locale-gen UTF-8

Install Nessus

Open download page and select latest version for Debian (as I wrote this tutorial it was Nessus-8.5.1-debian6_amd64.deb). Confirm and download. Via SCP, in new terminal, you can upload the file to your EC2 instance.

# copy file from local to remote
$ scp -i ~/.ssh/ ~/Downloads/Nessus-8.5.1-debian6_amd64.deb  admin@<instance>:/tmp

Back to instance terminal … Now install and start Nessus.

# install package
$ sudo dpkg -i /tmp/Nessus-8.5.1-debian6_amd64.deb

# start Nessus
$ sudo /etc/init.d/nessusd start

Use Nessus

To make our life easier, we will create a simple SSH port-forward.

# create port-forwarding
$ ssh -i ~/.ssh/ -L 8834:127.0.0.1:8834 admin@<instance>

# open browser
$ open https://localhost:8834

Now you can open your favourite browser with URL: https://localhost:8834.

Nessus Initialization
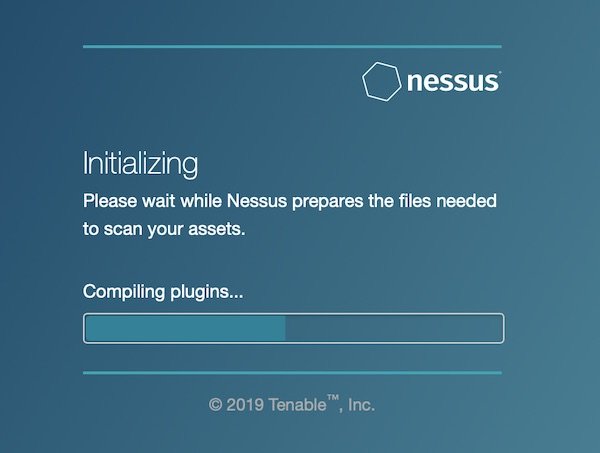
Initialisation of Nessus

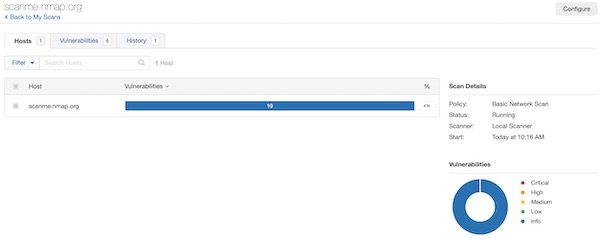
When the initialization has been completed successfully, login and create a new scan. Select “Basic Network Scan” and add URL: http://scanme.nmap.org. Select “Basic Network Scan” and “Port scan (common ports)” for scan settings. Save and start your created scan. Please be patient, the scan will take a while.

Nessus scan
Running Nessus scan

Create a scan report

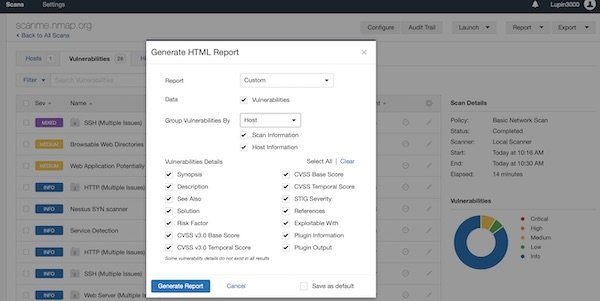
After a while, the scan is complete. Now you can create a “Custom” report. BTW … feature is only available for completed scans. So select “Export” – “Custom” and generate the report.

Nessus Report
Create custom HTML report

HTTPS and Wireshark

Using the two browsers (Firefox and Chrome), I’ll show you how to analyze the TLS traffic with Wireshark. If you only want to use one of the browsers, you can, of course.

What you need?

  • Wireshark (latest version)
  • Google Chrome (latest version)
  • Firefox (latest version)

Let’s start

After export do not change or restart you terminal. Or set an environmental variable (global/user specific) for example in .bashrc/.bash_profile/etc. file.

# create empty file
$ touch ~/Desktop/keys.log

# create environment variable
$ export SSLKEYLOGFILE=$HOME/Desktop/keys.log

# start Firefox
$ /Applications/Firefox.app/Contents/MacOS/firefox-bin --ssl-key-log-file=$HOME/Desktop/keys.log

# start Chrome
$ /Applications/Google\ Chrome.app/Contents/MacOS/Google\ Chrome --ssl-key-log-file=$HOME/Desktop/keys.log

In another terminal, you can watch the file.

# tail file (optional)
$ tail -f ~/Desktop/keys.log
...
CLIENT_RANDOM
33da89e4b6d87d25956fd8e8c1e6965575e379ca263b145c8c1240c7f76b0d2a
348d23440ef23807a88c9bda8c8e5826316b15bba33bbfe776120fb9d711c1b04dcf8
1e99e4a58e9d0c57ac955f12a7
...

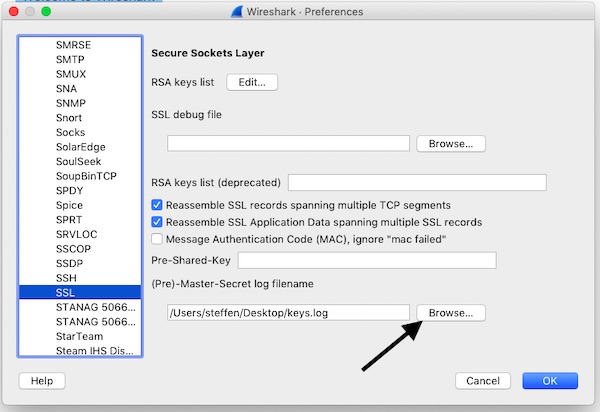
Wireshark and open Preferences -> Protocols -> SSL. Browse here for file “$HOME/Desktop/keys.log” and confirm your settings.

Wireshark SSL Settings

Start your record (may with filters) and open URL in browser. For example, you can now view the data in Wireshark via the “Decrypted SSL data” tab.

Create QA dashboards with Grafana (Part 5)

In the last tutorial of this series, we create the dashboards for testing and support. Part 1, Part 2, Part 3 and Part 4 should have been successfully completed.

Dashboard Testing

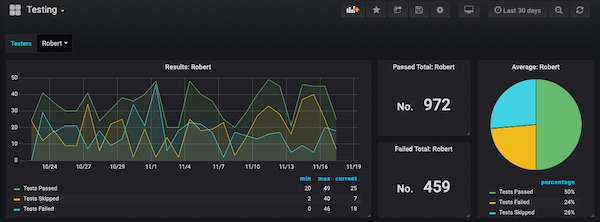
First, I show the result. With a little Drag & Drop and resizing, your dashboard might look like this. But after all, it’s up to your creativity how the results look.

Final Dashboard Testing

I will just show now the most important configurations, from the 4th part you should already know the others.

Add following panels. 1x Graph panel, 2x Singlestat panel and 1x Pie Chart panel. Now edit the Graph panel.

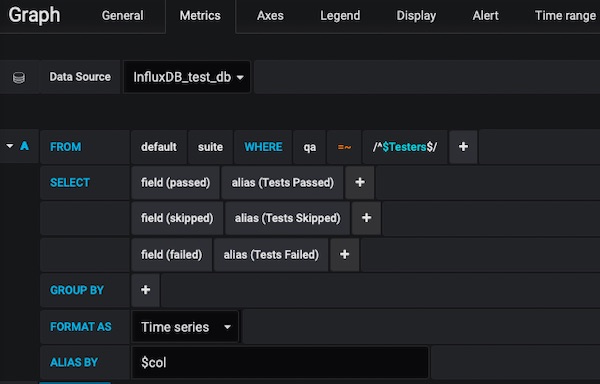
Under tab General enter for Title: Results: $Testers. On tab Metrics select Data Source InfluxDB_test_db and enter From: default suite WHERE: qa =~ /^$Testers$/, SELECT: field(passed) alias(Test Passed) field(skipped) alias(Tests Skipped) field(failed) alias(Tests Failed), FORMAT AS: Time series and ALIAS BY: $col.

Testing Graph Metrics

For tab Axes just enable Show checkbox on Left Y and X-Axis, Unit: short, Scale: linear and Mode: Time. On tab Legend enable checkboxes Show, As Table, Min, Max and Current. On tab Display enable only checkbox Lines.

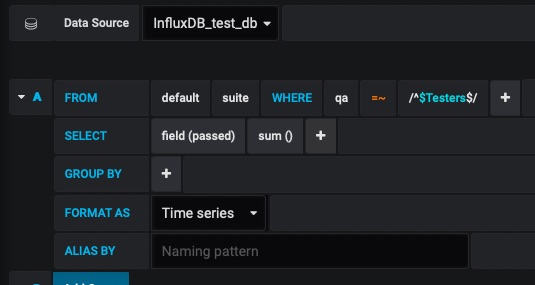
Now you can edit the Singlestat panels (one after the other). Here the important screens for Passed Total: $Testers:

Testing Singlestat Metrics

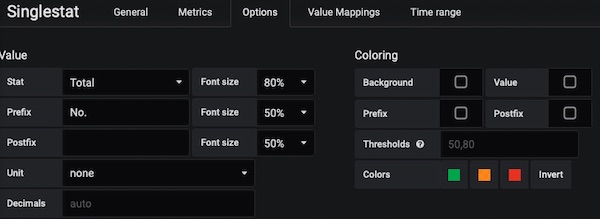
Tab Options (Singlestat)

Testing Singlestat Options

For Singlestat Failed Total: $Testers, just change field(passed) to field(failed).

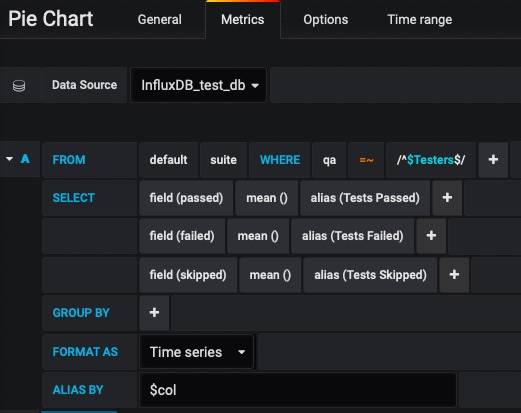
The Pie Chart Average: $Testers is simple, too. Here are the most important settings.

Testing Pie Chart Metrics

Tab Options (Pie Chart)

Testing Pie Chart Options

You’re done with 2nd dashboard. Don’t forget to save (incl. variables and so on)!

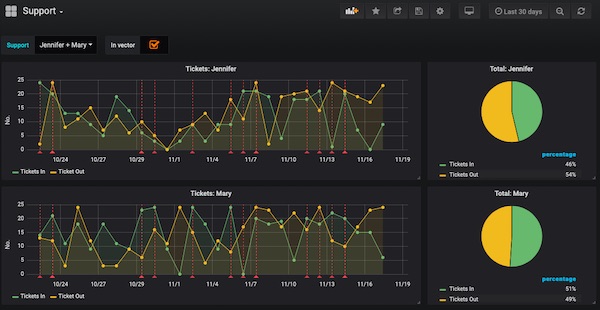
Dashboard Support

Let’s get to the last dashboard (Support). Again, the result.

Final Dashboard Support

Now add the following panels. 1x Graph panel and 1x Pie Chart panel (we dynamically generate the others).

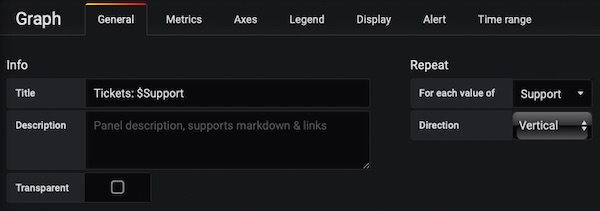
Here now the important settings. On tab General have attentions to Repeat!

Support Graph General

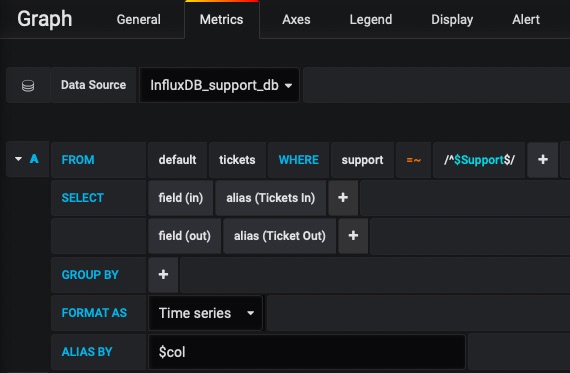
Tab Metrics (Graph)

Support Graph Metrics

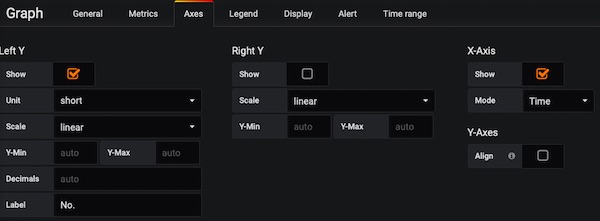
Tab Axes (Graph)

Support Graph Axes

Tab Display (Graph)

Support Graph Display

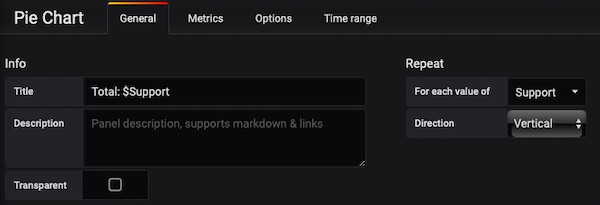
The tab Legend for Graph panel have only Show checkbox enabled. Let’s go to the Pie Chart settings. On tab General have attentions to Repeat!

Support Pie Chart General

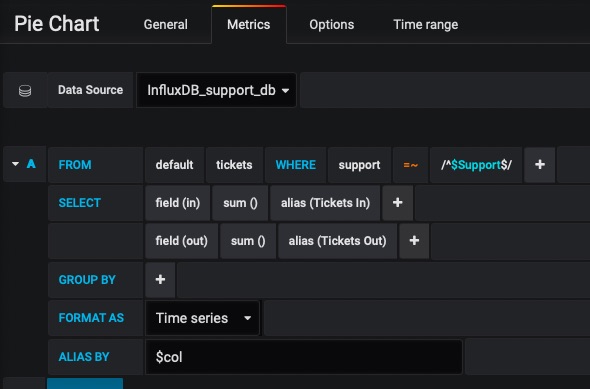
Tab Metrics (Pie Chart)

Support Pie Chart Metrics

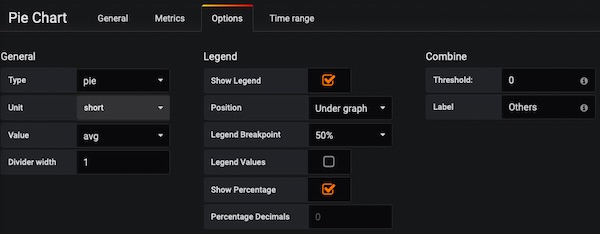
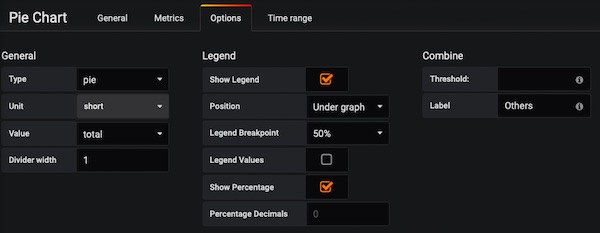
Tab Options (Pie Chart)

Support Pie Chart Options

That’s it with this series. I hope you have all the knowledge to create with Grafana awesome QA dashboards.

Create QA dashboards with Grafana (Part 4)

Finally, we can create the first dashboard. The prerequisite for this is that you have successfully completed the previous tutorials (Part1, Part2, Part3).

Pipeline graph panel

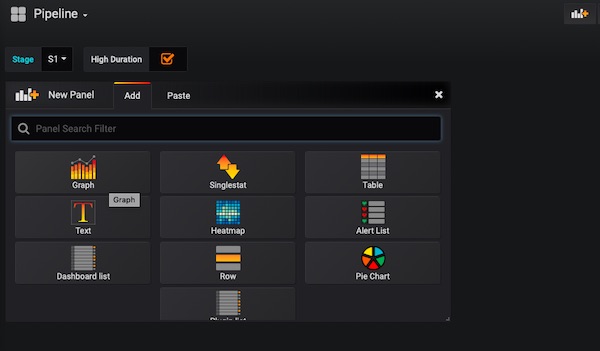
Now go to the still empty dashboard Pipeline. Add the Graph Panel here and select Edit in the title of panel.

Pipeline Graph Panel

In the Metrics tab you now enter the following values. Data Source: InfluxDB_pipeline_db, From: default, pipeline, WHERE: stage =~ /^$Stage$/, SELECT: field(duration), FORMAT AS: Time series and ALIAS BY: Duration.

Note: In case your graph is not displayed correctly, select on the Time picker dropdown: Last 30 days.

Pipeline Graph Metrics

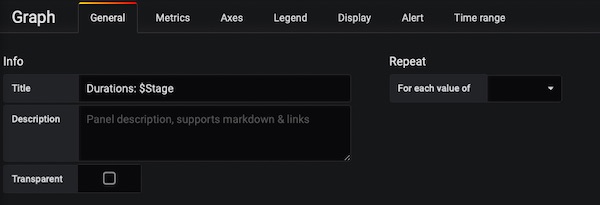
Change to General tab and enter for Title: Duration: $Stage.

Pipeline Graph General

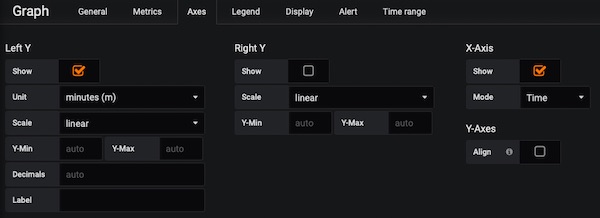
Change to Axes tab and enable checkboxes Show for Left Y and X-Axis. The Unit value for Left Y should be: minutes(m).

Pipeline Graph Axes

Under tab Legend choose enable following checkboxes: Show, As Table, Min and Max. For Decimals enter value “2”.

Pipeline Graph Legend

Our last action for the Graph panel will be done in tab Display. Here we add the Threshold. T1: gt, 15, Color critical, enable checkbox Fill and Y-Axis: left.

Pipeline Graph Display

We are done with Graph panel … don’t forget to save!

Pipeline singlestat panel (Last Status)

Now we add 2 more singlestat panels. One should show the Last Status and the other Last Duration. Press Edit for Last Status panel.

Pipeline Singlestat Panel

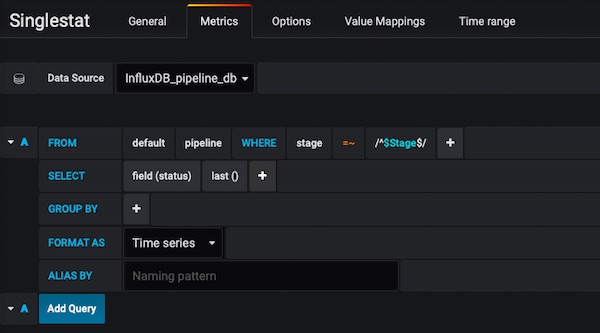
In the Metrics tab you now enter the following values. Data Source: InfluxDB_pipeline_db, From: default, pipeline, WHERE: stage =~ /^$Stage$/, SELECT: field(status)last() and FORMAT AS: Time series.

Pipeline Singlestat Metrics

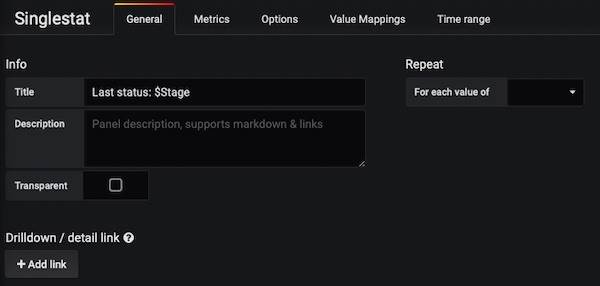
Change to General tab and enter for Title: Last status: $Stage.

Pipeline Singlestat General

Close Panel edit mode and save.
Pipeline singlestat panel (Last Duration)

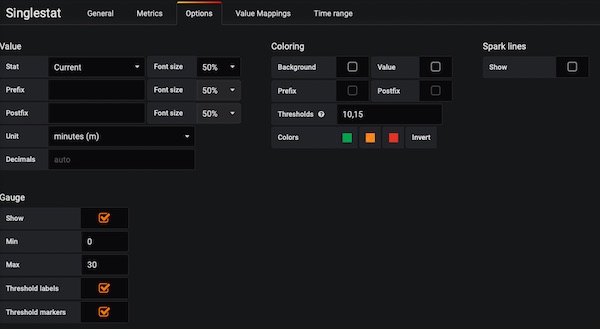
Last Singlestat will have following Metrics. Data Source: InfluxDB_pipeline_db, From: default, pipeline, WHERE: stage =~ /^$Stage$/, SELECT: field(duration) and FORMAT AS: Time series. Under tab General just add Title: Last Duration: $Stage.

Pipeline Singlestat Options

For tab Options select Stat: Current, Font size: 50%, Unit: minutes(m), Thresholds: 10,15, enable checkbox Show for Gauge, Min: 0, Max: 30 and enable checkboxes Threshold labels plus Threshold markers. Close Edit mode and save.
Final Pipeline Dashboard
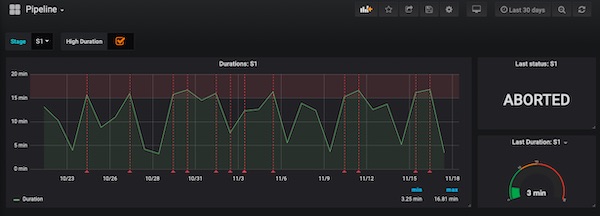
Now you can play with the size and placement of the panels. My Pipeline dashboard now looks like this:

Pipeline Final Dashboard

If you change the variables (S1, S2, S3), the values ​​of the panels should change.

This leaves only 2 dashboards left. See you in next tutorial.

Create QA dashboards with Grafana (Part 3)

In the third part of this tutorial series we will create Query Variables and Annotations for our three Dashboards (Testing, Support, Pipeline). Thus, we can later provide interactive dashboards (instead of static ones). Stakeholders should be able to independently filter or select information, which makes the Grafana dashboards more interesting.

Note: This part assumes that you have completed the first and second part successfully.

Variables for dashboard Testing

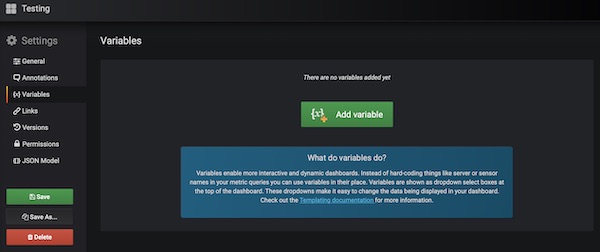
For Dashboard Testing we need a query variable: QA. Go to the Dashboard Settings on Testing. Now select the “Add variable” button in the “Variables” category.

Grafana Dashboard Variables

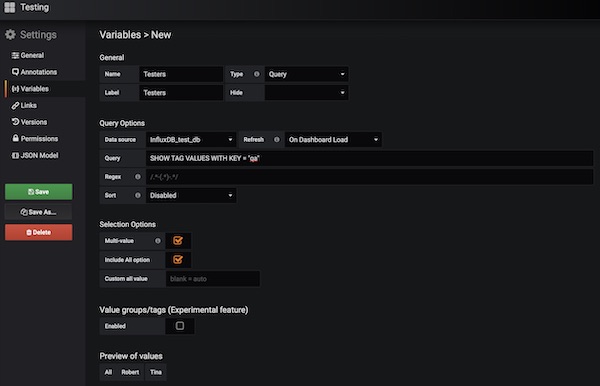
Assign a unique name and label: Testers, select as Type: Query, Data source: InfluxDB_test_db and Refresh: On Dashboard Load. As Query insert: SHOW TAG VALUES WITH KEY = “qa”. In the Preview you should see already all values. Last enable checkboxes for Multi-value and Include all value. Press “Add” and “Save” buttons when you’r done.

Grafana Variables Testing

On the empty dashboard should now be a dropdown, with the values ​​visible.

Variables and annotations for dashboard Support

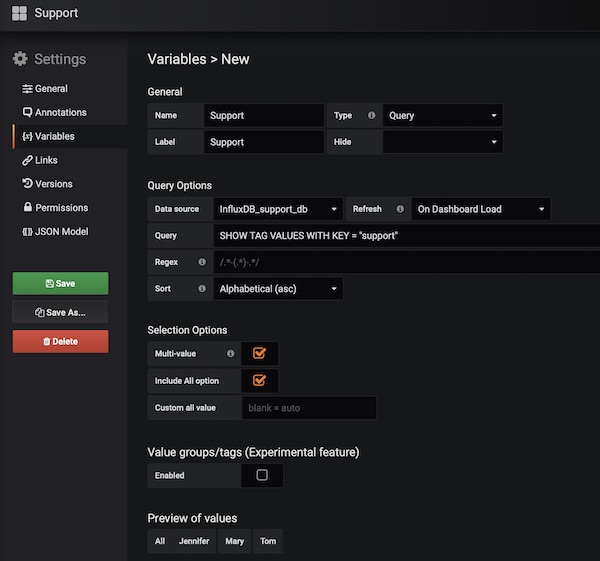
For Dashboard Support we need a query variable: Support. Assign a unique name and label: Support, select as Type: Query, Data source: InfluxDB_support_db, Refresh: On Dashboard Load and Sort: Alphabetical (asc). As Query insert: SHOW TAG VALUES WITH KEY = “support”. In the Preview you should see already all values. Last enable checkboxes for Multi-value and Include all value. Press “Add” and “Save” buttons when you’r done.

Grafana Variables Support

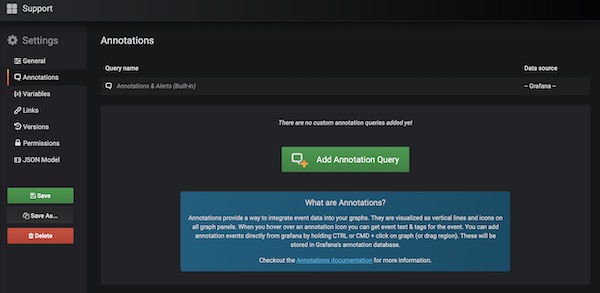
In addition, this dashboard should also have an annotation. Select the “Add Annotation Query” button in the “Annotations” category.

Grafana Dashboard Annotations

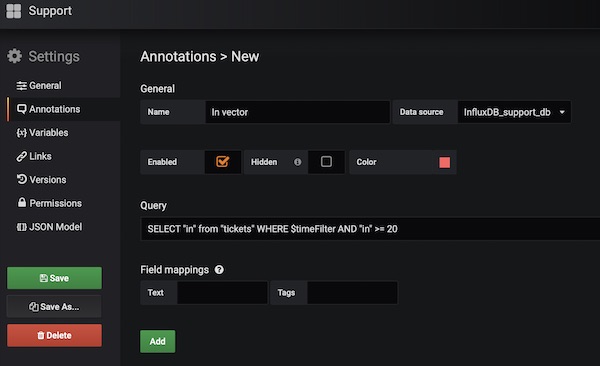
Give name: In vector, select Data source: InfluxDB_support_db, enable checkbox: Enabled and add Query: SELECT FROM “in” FROM “tickets” WHERE $timeFilter AND “in” >= 20. Press button’s “Add” and “Save”.

Grafana Annotations Support

On the empty dashboard should now be a dropdown and a checkbox.

Variables and annotations for dashboard Pipelines

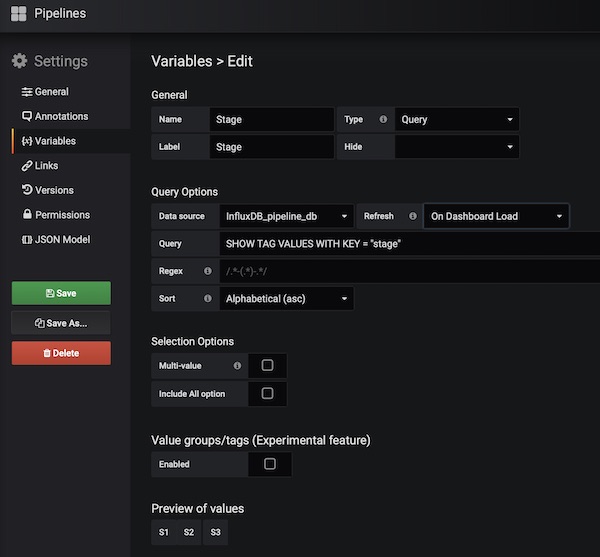
Our last dashboard Pipelines will have a variable and annotation, too. Create therefore a variable with following configuration. Name/Label: Stage, Type: Query, Data source: InfluxDB_pipeline_db, Refresh: On Dashboard Load, Query: SHOW TAG VALUES WITH KEY = “stage” and Sort: Alphabetical (asc). Press buttons “Add” and “Save”.

Grafana Variables Pipelines

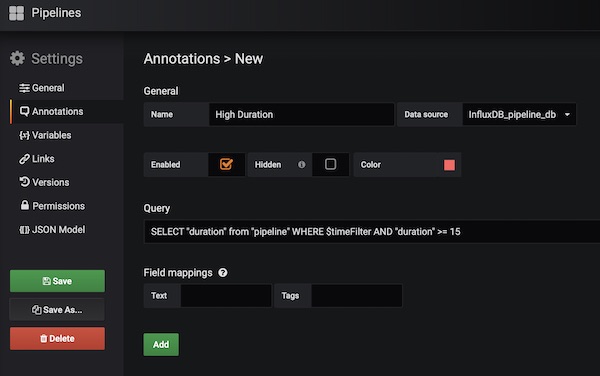
For the annotation give following values. Name: High Duration, Data source: InfluxDB_pipeline_db, Enabled and Query: SELECT “duration” FROM “pipeline” WHERE $timeFilter AND “duration” >= 15. Press “Add” and “Save”.

Grafana Annotations Pipelines

On the empty dashboard should now be a dropdown and a checkbox.

Okay … that’s it for the third part. In the 4th part we will finally add the pannels in the respective dashboards.

Create QA dashboards with Grafana (Part 2)

In the first part of this tutorial series, you created the environment and recorded some fictional data into InfluxDB. Now log in to Grafana and create data sources for your dashboard pannels.

The next steps will only be performed if you have stopped the environment via docker-compose stop.

# go to Project directory
$ cd ~/Projects/GrafanaDemo/

# start environment
$ docker-compose start

# open Grafana in browser (and login)
$ open http://localhost:3000

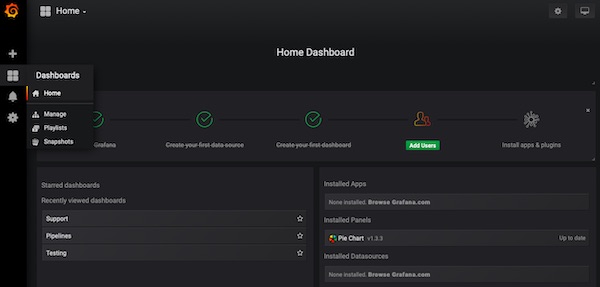
You should now find yourself on the Home Dashboard.

Data Sources

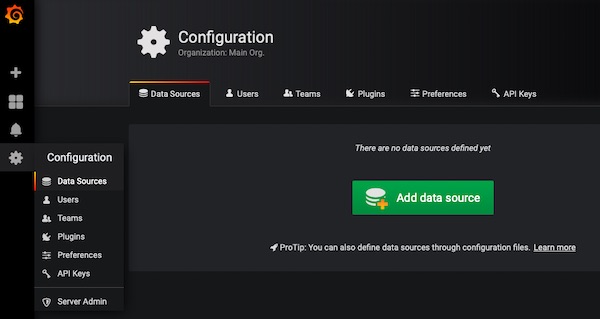
The first step is to create the InfluxDB data sources for the metrics to be available in Grafana. To do this, navigate to Data Sources now.

Grafana Data Sources

Now click on “Add data source”. We will do this step 2 more times. For each database (test_db, support_db, pipeline_db) in InfluxDB we will specify a separate connection.

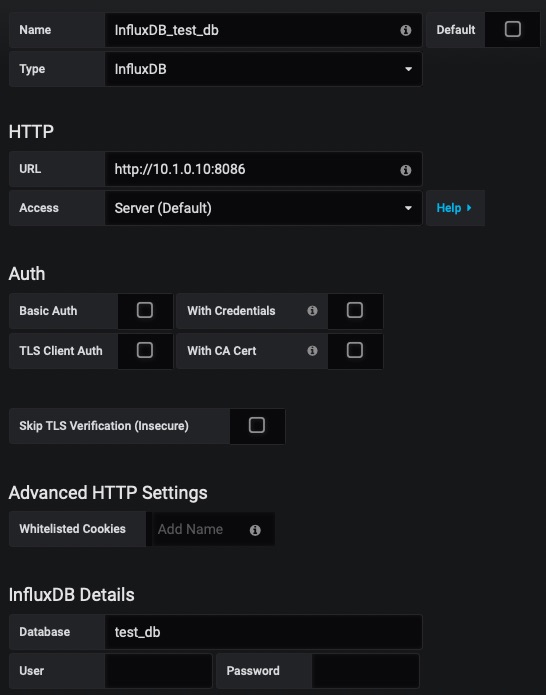
Assign a unique name (like InfluxDB_test_db), select as Type: InfluxDB, enter the URL: http://10.1.0.10:8086, select Access: Server (Default) and Database: test_db. Finally, press the “Save & Test” button. Additional values ​​are not necessary for this tutorial.

Grafana Data Source Configuration

If everything went well, you should get the hint “Data source is working.”

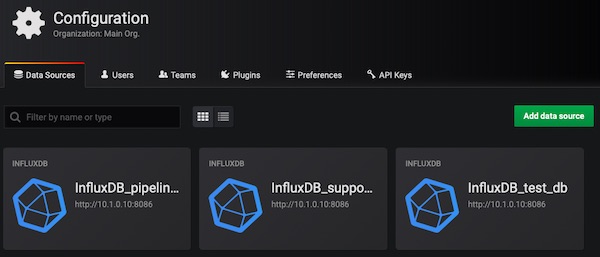
Repeat the process for the other two InfluxDB databases (support_db, pipeline_db). Pay attention to the values ​​of name and database. In the end, your configuration should look like this:

Grafana InfluxDB Data Sources

Dashboards

In this step, you will now create three empty dashboards (under General). Similar to the Data Sources – one for each database. Switch to Manage – Dashboards.

Grafana Dashboards

Select the “+ Dashboard” button. Before adding panels, give the dashboard a unique name. To do this, select the “Settings” icon (top right).

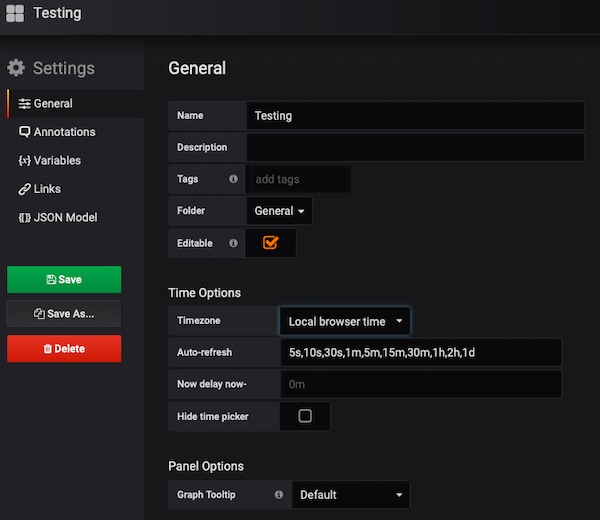
Give the name value, for example “Testing” and for Timezone choose: Local Browser Time. Finally, press the “Save” button.

Grafana Dashboard Settings

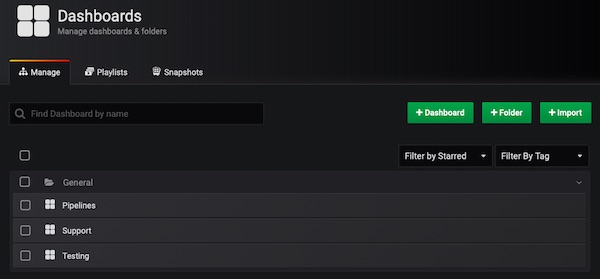
Repeat the process 2 more times. In the end, you should have created 3 empty dashboards (eq. Testing, Support and Pipelines).

Grafana Dashboards Overview

Perfect, you should now be able to see your 3 dashboards on the “Home Dashboard”.

Grafana Home Dashboard

In the third part of the series, you will learn to create annotation and variables for each dashboard. I hope you had fun and that you have been able to learn something new till here. See you soon in 3rd part.

Create QA dashboards with Grafana (Part 1)

Since I have my new role (Head of QA), many employees constantly want metrics from me. That means a lot of work for me. But since I do not always want to deal with such things, I have searched for a simpler way. So the question was – how can I deliver this data at any time and possibly from different sources (eq. JIRA, pipelines, test results, Salesforce, etc.)? Hmmm … Grafana is awesome – not only for DevOps! So in this tutorial series, I’d like to show you how to create nice and meaningful dashboards for your QA metrics in Grafana.

What you need?

  • Docker installed (latest version)
  • Bash (min. 3.2.x)

Prepare the project

In order to create dashboards in Grafana, you need a small environment (Grafana/InfluxDB) as well as some data. The next steps will help you to create them. The environment/services are simulated by docker containers. For the fictitious data, just use the bash script which I created for this tutorial.

# create project
$ mkdir -p ~/Projects/GrafanaDemo && cd ~/Projects/GrafanaDemo

# create file docker-compose.yml
$ touch docker-compose.yml

# create file CreateData.sh
$ touch CreateData.sh

# change file permissions
$ chmod u+x CreateData.sh

Now copy/paste the content of the two files with your favorite editor. The content of docker-compose.yml.

version: '3'

networks:
  grafana-demo:
    driver: bridge
    ipam:
      driver: default
      config:
        - subnet: 10.1.0.0/24

services:

  influxdb:
    container_name: influxdb
    networks:
      grafana-demo:
        ipv4_address: 10.1.0.10
    ports:
      - '8086:8086'
    image: influxdb

  grafana:
    container_name: grafana
    networks:
      grafana-demo:
        ipv4_address: 10.1.0.20
    ports:
      - '3000:3000'
    image: grafana/grafana
    environment:
      - 'GF_INSTALL_PLUGINS=grafana-piechart-panel'
    depends_on:
      - influxdb

And here the content of CreateData.sh.

#!/usr/bin/env  bash

# shell options
#set -x
#set -v
set -e
set -u
set -f

# magic variables
declare -r OPTS="htsp"
declare -a TIMESTAMPS
declare -a OPTIONS=(false false false)
declare -r -a DATABASES=(test_db support_db pipeline_db)
declare -r -a TESTER=(Tina Robert)
declare -r -a SUPPORTER=(Jennifer Mary Tom)
declare -r -a STAGES=(S1 S2 S3)
declare -r -a BUILD=(SUCCESS FAILURE ABORTED)
declare -r -i SUCCESS=0
declare -r -i BAD_ARGS=85
declare -r -i NO_ARGS=86

# functions
function usage() {
  local count
  local file_name=$(basename "$0")

  printf "Usage: %s [options...]\n" "$file_name"
  for (( count=1; count<${#OPTS}; count++ )); do
    printf "%s\tcreate %s and content\n" "-${OPTS:$count:1}" "${DATABASES[$count - 1]}"
  done
  exit "$SUCCESS"
}

function bad_args() {
  printf "Error: Wrong arguments supplied\n"
  usage
  exit "$BAD_ARGS"
}

function no_args() {
  printf "Error: No options were passed\n"
  usage
  exit "$NO_ARGS"
}

function create_timestamp_array() {
  local counter=1
  local timestamp

  while [ "$counter" -le 30 ]; do
    timestamp=$(date -v -"$counter"d +"%s")
    TIMESTAMPS+=("$timestamp")
    ((counter++))
  done
}

function curl_post() {
  local url=$(printf 'http://localhost:8086/write?db=%s&precision=s' "$2")

  curl -i -X POST "$url" --data-binary "$1"
}

function create_test_results() {
  local passed
  local failed
  local skipped
  local count
  local str

  for count in "${TESTER[@]}"; do
    passed=$((RANDOM % 30 + 20))
    failed=$((RANDOM % passed))
    skipped=$((passed - failed))
    str=$(printf 'suite,app=demo,qa=%s passed=%i,failed=%i,skipped=%i %i' "$count" "$passed" "$failed" "$skipped" "$1")
    echo "$2: $str"
    curl_post "$str" "$2"
  done
}

function create_support_results() {
  local items=(1 2 none)
  local in
  local out
  local str
  local count

  for count in "${SUPPORTER[@]}"; do
    in=$((RANDOM % 25))
    out=$((RANDOM % 25))
    str=$(printf 'tickets,support=%s in=%i,out=%i %i' "$count" "$in" "$out" "$1")
    echo "$2: $str"
    curl_post "$str" "$2"
  done
}

function create_pipeline_results() {
  local status
  local duration
  local str
  local count

  for count in "${STAGES[@]}"; do
    status=${BUILD[$RANDOM % ${#BUILD[@]} ]}
    duration=$(( 3+RANDOM%(3-17) )).$(( RANDOM%999 ))
    str=$(printf 'pipeline,stage=%s status="%s",duration=%s %i' "$count" "$status" "$duration" "$1")
    echo "$2: $str"
    curl_post "$str" "$2"
  done
}

function main() {
  local repeat=$(printf '=%.0s' {1..80})

  create_timestamp_array

  for ((i = 0; i < ${#OPTIONS[@]}; ++i)); do
    if [[ "${OPTIONS[$i]}" == "true" ]]; then
      printf "Create database: %s\n" "${DATABASES[$i]}"
      printf "%s\n" "$repeat"
      curl -i -X POST http://localhost:8086/query --data-urlencode "q=CREATE DATABASE ${DATABASES[$i]}"
      printf "Generate content of database: %s\n" "${DATABASES[$i]}"
      printf "%s\n" "$repeat"
      for item in "${TIMESTAMPS[@]}"; do
        if [[ "${DATABASES[$i]}" == "${DATABASES[0]}" ]]; then
          create_test_results "$item" "${DATABASES[$i]}"
        fi
        if [[ "${DATABASES[$i]}" == "${DATABASES[1]}" ]]; then
          create_support_results "$item" "${DATABASES[$i]}"
        fi
        if [[ "${DATABASES[$i]}" == "${DATABASES[2]}" ]]; then
          create_pipeline_results "$item" "${DATABASES[$i]}"
        fi
      done
    fi
  done
}

# script arguments
while getopts "$OPTS" OPTION; do
  case "$OPTION" in
    h)
        usage;;
    t)
        OPTIONS[0]="true";;
    s)
        OPTIONS[1]="true";;
    p)
        OPTIONS[2]="true";;
    *)
        bad_args;;
  esac
done

if [ $OPTIND -eq 1 ]; then
  no_args
fi

# main function
main

# exit
exit "$SUCCESS"

Start environment and create data

Once the project and the files have been created, you can build and start the environment. For this you use Docker Compose.

# validate docker-compose file (optional)
$ docker-compose config

# run environment
$ docker-compose up -d

# get IP from grafana container (optional)
$ docker inspect -f '{{range .NetworkSettings.Networks}}{{.IPAddress}}{{end}}' grafana
10.1.0.20

# get IP from influxdb container (optional)
$ docker inspect -f '{{range .NetworkSettings.Networks}}{{.IPAddress}}{{end}}' influxdb
10.1.0.10

# show created docker network (optional)
$ docker network ls | grep -i 'grafana*'

# show docker containers (optional)
$ docker ps -a | grep -i 'grafana\|influxdb'

In next step you create the InfluxDB databases (incl. fictitious measurements, series and data) via Bash script.

# ping influxdb (optional)
$ curl -I http://localhost:8086/ping

# show help (optional)
$ ./CreateData.sh -h

# create databases and contents (execute only 1x)
$ ./CreateData.sh -t -s -p

# show current databases (optional)
$ curl -G http://localhost:8086/query?pretty=true --data-urlencode "q=SHOW DATABASES"

# show test_db series (optional)
$ curl -G http://localhost:8086/query?pretty=true --data-urlencode "db=test_db" --data-urlencode "q=SHOW SERIES"

# show test_db measurements (optional)
$ curl -G http://localhost:8086/query?pretty=true --data-urlencode "db=test_db" --data-urlencode "q=SHOW MEASUREMENTS"

Note: You could use influx command to administrate InfluxDB directly.

# exec docker container
$ docker exec -ti influxdb influx

# list all databases
> show databases

# use specific database test_db
> use test_db

# show series of test_db
> show series

# show measurements of test_db
> show measurements

# drop measurements of test_db (in case something went wrong)
> drop measurement suite

Okay the environment preparation is done. Now start Grafana in browser.

# open Grafana in browser
$ open http://localhost:3000

New Grafana Login

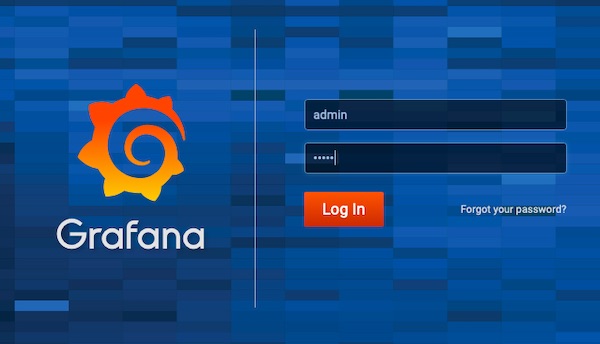
The default username and password is “admin:admin“. Note, if you use docker-compose down you have to repeat most of steps like data creation. Better use docker-compose stop! … See you in 2nd part – where we add data sources and create dashboards.