OpenCV & SSD-Mobilenet-v2

The first steps with OpenCV and haarcascades are done and now it should really start. With other models you can detect easily more objects. In this tutorial I will show you therefore a different possibility with your Jetson Nano device. I recommend switching to desktop mode for performance reasons.

Requirements

  • Jetson Nano Developer Kit (2GB / 4GB)
  • 5V Fan installed (NF-A4x20 5V PWM)
  • CSI camera connected (Raspberry Pi Camera Module V2)

Note: You can also use any other compatible fan and camera.

Objective

The goal is to recognize objects as well to mark and label them directly in the live stream from CSI camera. OpenCV and SSD-Mobilenet-v2 with Python3.6 are used for in this tutorial.

Preparation

As always, it takes a few steps to prepare. This is very easy but can take a while.

# update (optional)
$ sudo apt update

# install needed packages
$ sudo apt install cmake libpython3-dev python3-numpy

# clone repository
$ git clone --recursive https://github.com/dusty-nv/jetson-inference.git

# change into cloned directory
$ cd jetson-inference/

# create and change into directory
$ mkdir build && cd build/

# configure build
$ cmake ../

# download only SSD-Mobilenet-v2
# all other you can download later
# PyTorch is also not needed yet

# build with specified job and install
$ make -j$(nproc)
$ sudo make install

# configure dynamic linker run-time bindings
$ sudo ldconfig

CSI Camera Object detection

When the preparation is successfully completed, you can create the first simple Python script.

# create file and edit
$ vim CSICamObjectDetection.py

Here is the content of the script. The important points are commented.

#!/usr/bin/env python3

import jetson.inference
import jetson.utils
import cv2

# set interference
net = jetson.inference.detectNet("ssd-mobilenet-v2", threshold=0.5)


def gstreamer_pipeline(cap_width=1280,
                       cap_height=720,
                       disp_width=800,
                       disp_height=600,
                       framerate=21,
                       flip_method=2):
    return (
        "nvarguscamerasrc ! "
        "video/x-raw(memory:NVMM), "
        "width=(int)%d, height=(int)%d, "
        "format=(string)NV12, framerate=(fraction)%d/1 ! "
        "nvvidconv flip-method=%d ! "
        "video/x-raw, width=(int)%d, height=(int)%d, format=(string)BGRx ! "
        "videoconvert ! "
        "video/x-raw, format=(string)BGR ! appsink" % (cap_width,
                                                       cap_height,
                                                       framerate,
                                                       flip_method,
                                                       disp_width,
                                                       disp_height)
    )


# process csi camera
video_file = cv2.VideoCapture(gstreamer_pipeline(), cv2.CAP_GSTREAMER)

if video_file.isOpened():
    cv2.namedWindow("Detection result", cv2.WINDOW_AUTOSIZE)

    print('CSI stream opened. Press ESC or Ctrl + c to stop application')

    while cv2.getWindowProperty("Detection result", 0) >= 0:
        ret, frame = video_file.read()

        # convert and detect
        imgCuda = jetson.utils.cudaFromNumpy(frame)
        detections = net.Detect(imgCuda)

        # draw rectangle and description
        for d in detections:
            x1, y1, x2, y2 = int(d.Left), int(d.Top), int(d.Right), int(d.Bottom)
            className = net.GetClassDesc(d.ClassID)
            cv2.rectangle(frame, (x1,y1), (x2, y2), (0, 0, 0), 2)
            cv2.putText(frame, className, (x1+5, y1+15), cv2.FONT_HERSHEY_DUPLEX, 0.75, (0, 0, 0), 2)

        # show frame
        cv2.imshow("Detection result", frame)

        # stop via ESC key
        keyCode = cv2.waitKey(30) & 0xFF
        if keyCode == 27 or not ret:
            break

    # close
    video_file.release()
    cv2.destroyAllWindows()
else:
    print('unable to open csi stream')

Now you can run the script. It will take a while the first time, so please be patient.

# execute
$ python3 CSICamObjectDetection.py

# or with executable permissions
$ ./CSICamObjectDetection.py

I was fascinated by the results! I hope you feel the same way.
macOS, Docker, Prometheus and Grafana

I like Grafana … the dashboards are just cool! Here (again) a tutorial about docker monitoring. In less minutes you should be done. As a comment … for Linux and Windows you can do that too! There are only partial changes.

Prepare Project

# create project
$ mkdir -p ~/Projects/DPG && cd ~/Projects/DPG

# show current IP
$ ifconfig | grep "inet " | grep -v 127.0.0.1

# create and edit prometheus.yml
$ vim prometheus.yml

Replace <yourLocalIP> with your IP. On Docker website you can find templates for Linux and Windows, too!

# my global config
global:
  scrape_interval:     15s # Set the scrape interval to every 15 seconds. Default is every 1 minute.
  evaluation_interval: 15s # Evaluate rules every 15 seconds. The default is every 1 minute.
  # scrape_timeout is set to the global default (10s).

  # Attach these labels to any time series or alerts when communicating with
  # external systems (federation, remote storage, Alertmanager).
  external_labels:
      monitor: 'codelab-monitor'

# Load rules once and periodically evaluate them according to the global 'evaluation_interval'.
rule_files:
  # - "first.rules"
  # - "second.rules"

# A scrape configuration containing exactly one endpoint to scrape:
# Here it's Prometheus itself.
scrape_configs:
  # The job name is added as a label `job=<job_name>` to any timeseries scraped from this config.
  - job_name: 'prometheus'

    # metrics_path defaults to '/metrics'
    # scheme defaults to 'http'.

    static_configs:
      - targets: ['localhost:9090']

  - job_name: 'docker'
         # metrics_path defaults to '/metrics'
         # scheme defaults to 'http'.

    static_configs:
      - targets: ['<yourLocalIP>:9323']

Configure Docker

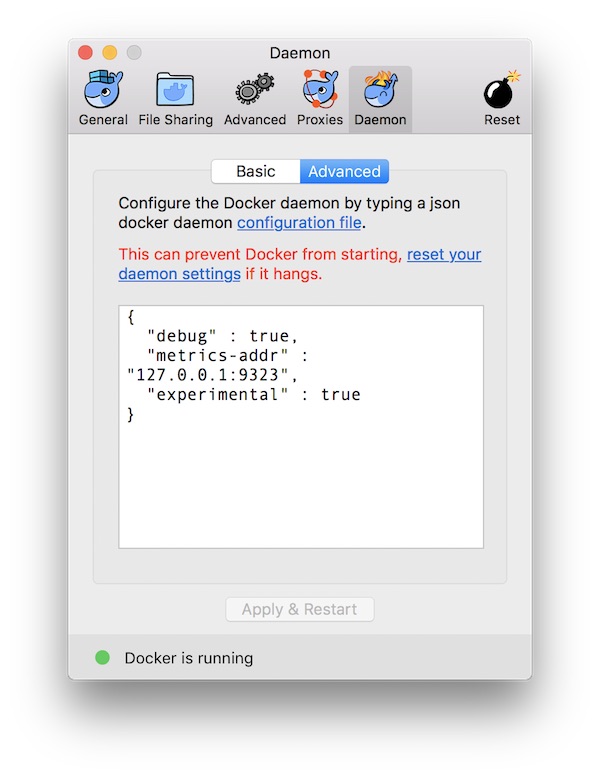
This step is very easy. Just open Docker “Preferences” and specify in section “Daemon” -> “Advanced” the metrics-address. Just ensure that you use valid JSON!

macOS Docker Metrics

When you are done, press “Apply and Restart” button.

# view Docker metrics in browser
$ open -a Safari http://127.0.0.1:9323/metrics

Prepare Prometheus

# run Prometheus
$ docker run --name prometheus -p 9090:9090 -v $PWD/prometheus.yml:/etc /prometheus/prometheus.yml prom/prometheus

# open Prometheus WebUI
$ open -a Safari http://localhost:9090/targets

# get Prometheus IP
$ docker inspect --format '{{ .NetworkSettings.IPAddress }}' prometheus

Note: The space after /etc is just because of security settings of my provider! Please remove the space.

prometheus WebUI

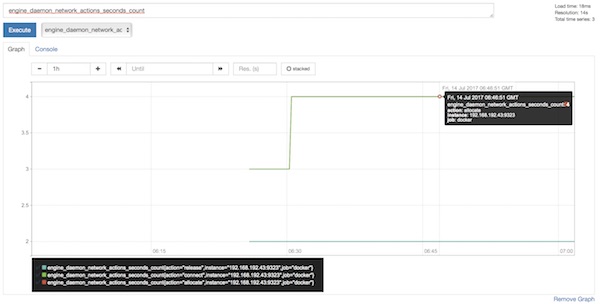
Just for fun you can create already some graphs in Prometheus.

prometheus Graph

Prepare and run Grafana

# run Grafana
$ docker run --name grafana -i -p 3000:3000 grafana/grafana

# open Grafana WebUI and login (admin:admin)
$ open -a Safari http://localhost:3000

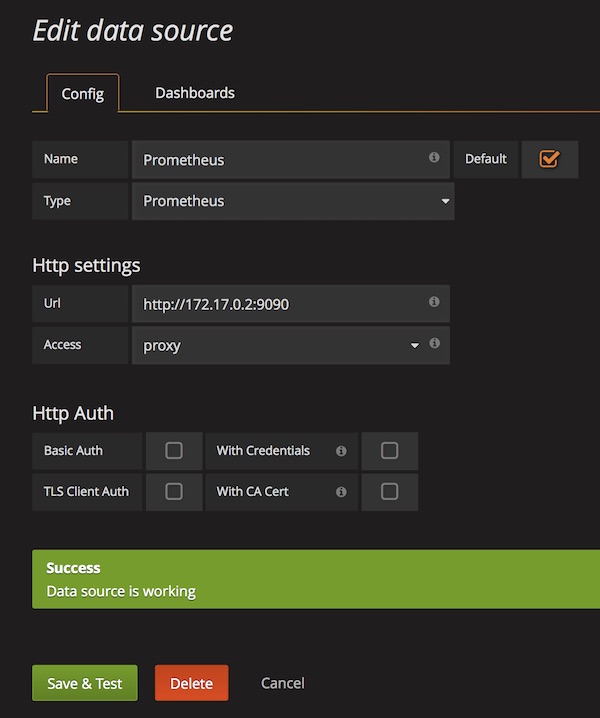
After login (admin:admin) configure new DataSource for Prometheus.

Grafana DataSource Prometheus

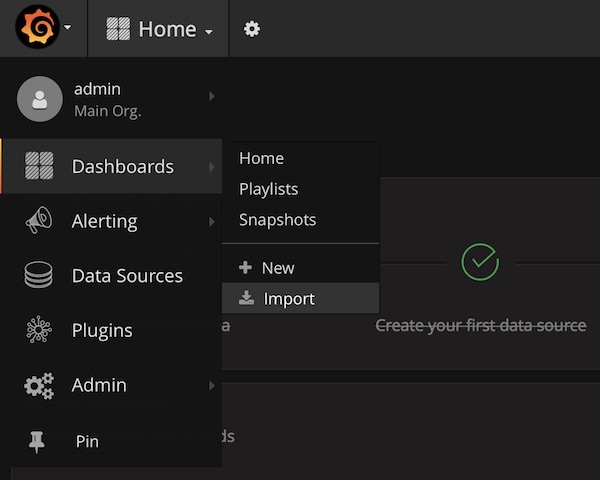
Import Dashboard (ID: 1229)

Grafana Import Dashboard

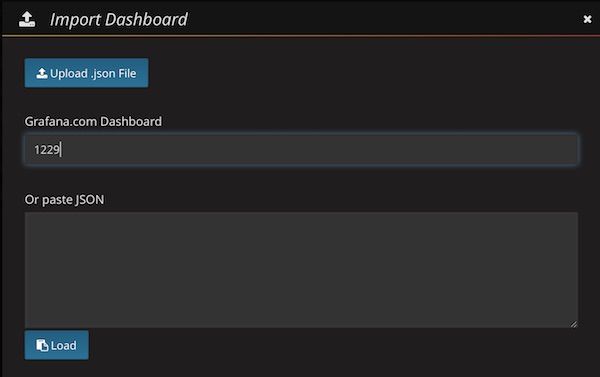
… enter ID 1229 …

Grafana Dashboard Search

… be patient (don’t press any button) …

Docker Engine Metrics Dashboard

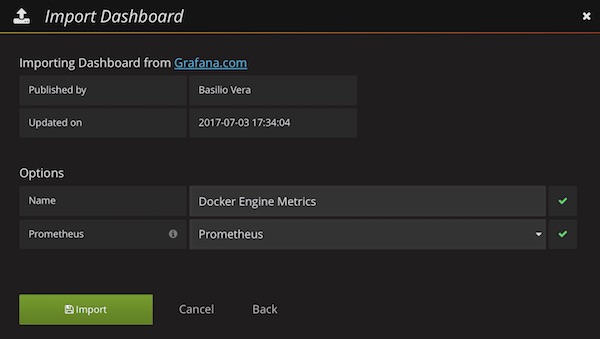
Select already created DataSource (Prometheus) and press “Import” button. Now you should see the awesome Grafana Dashboard.