I like Grafana … the dashboards are just cool! Here (again) a tutorial about docker monitoring. In less minutes you should be done. As a comment … for Linux and Windows you can do that too! There are only partial changes.
Prepare Project
# create project
$ mkdir -p ~/Projects/DPG && cd ~/Projects/DPG

# show current IP
$ ifconfig | grep "inet " | grep -v 127.0.0.1

# create and edit prometheus.yml
$ vim prometheus.yml
Replace <yourLocalIP> with your IP. On Docker website you can find templates for Linux and Windows, too!
# my global config
global:
  scrape_interval:     15s # Set the scrape interval to every 15 seconds. Default is every 1 minute.
  evaluation_interval: 15s # Evaluate rules every 15 seconds. The default is every 1 minute.
  # scrape_timeout is set to the global default (10s).

  # Attach these labels to any time series or alerts when communicating with
  # external systems (federation, remote storage, Alertmanager).
  external_labels:
      monitor: 'codelab-monitor'

# Load rules once and periodically evaluate them according to the global 'evaluation_interval'.
rule_files:
  # - "first.rules"
  # - "second.rules"

# A scrape configuration containing exactly one endpoint to scrape:
# Here it's Prometheus itself.
scrape_configs:
  # The job name is added as a label `job=<job_name>` to any timeseries scraped from this config.
  - job_name: 'prometheus'

    # metrics_path defaults to '/metrics'
    # scheme defaults to 'http'.

    static_configs:
      - targets: ['localhost:9090']

  - job_name: 'docker'
         # metrics_path defaults to '/metrics'
         # scheme defaults to 'http'.

    static_configs:
      - targets: ['<yourLocalIP>:9323']
Configure Docker
This step is very easy. Just open Docker “Preferences” and specify in section “Daemon” -> “Advanced” the metrics-address. Just ensure that you use valid JSON!
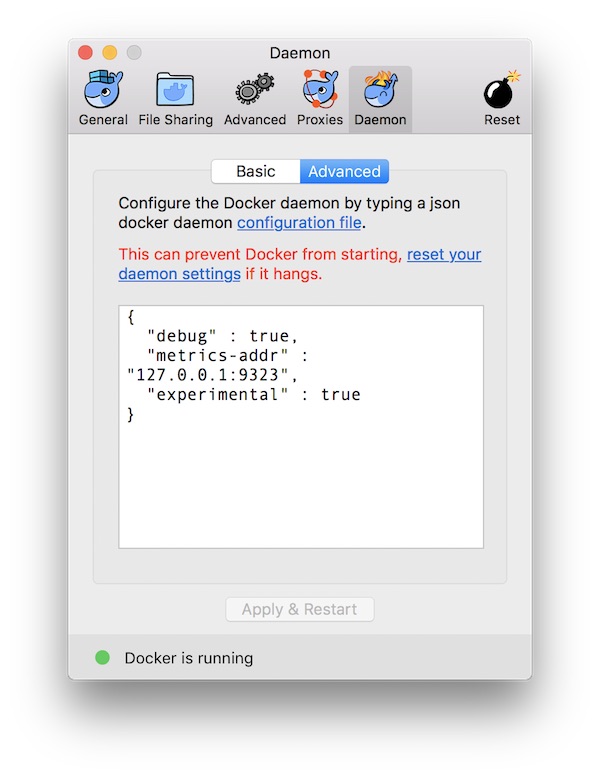
When you are done, press “Apply and Restart” button.
# view Docker metrics in browser
$ open -a Safari http://127.0.0.1:9323/metrics
Prepare Prometheus
# run Prometheus
$ docker run --name prometheus -p 9090:9090 -v $PWD/prometheus.yml:/etc /prometheus/prometheus.yml prom/prometheus

# open Prometheus WebUI
$ open -a Safari http://localhost:9090/targets

# get Prometheus IP
$ docker inspect --format '{{ .NetworkSettings.IPAddress }}' prometheus
Note: The space after /etc is just because of security settings of my provider! Please remove the space.

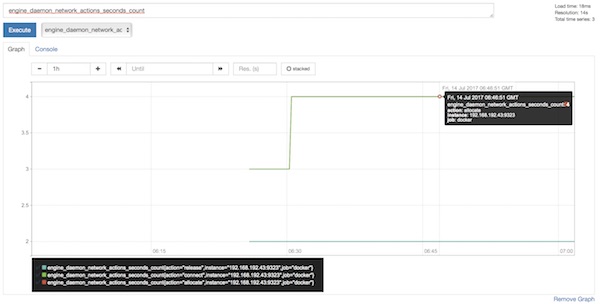
Just for fun you can create already some graphs in Prometheus.
Prepare and run Grafana
# run Grafana
$ docker run --name grafana -i -p 3000:3000 grafana/grafana

# open Grafana WebUI and login (admin:admin)
$ open -a Safari http://localhost:3000
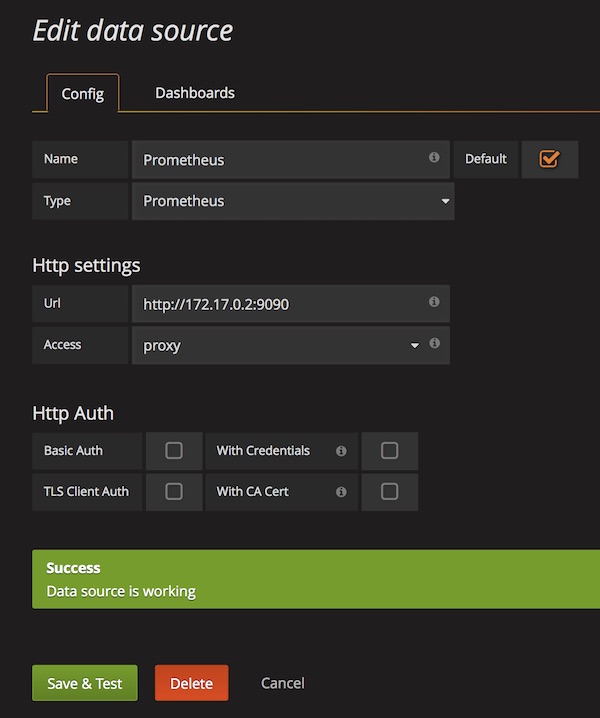
After login (admin:admin) configure new DataSource for Prometheus.
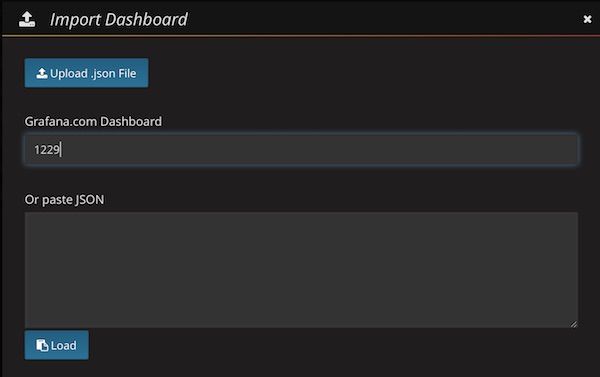
Import Dashboard (ID: 1229)
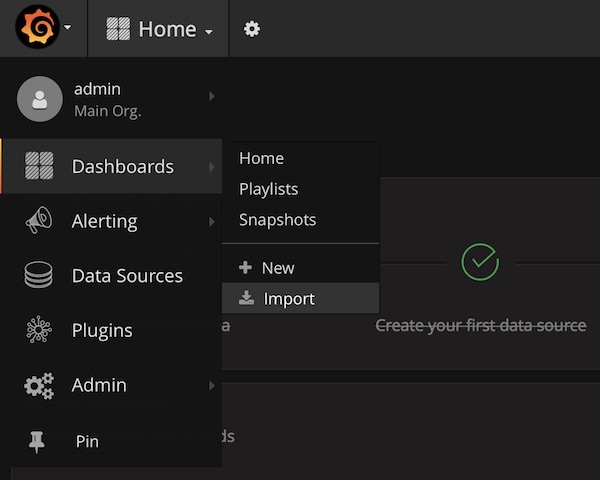
… enter ID 1229 …
… be patient (don’t press any button) …
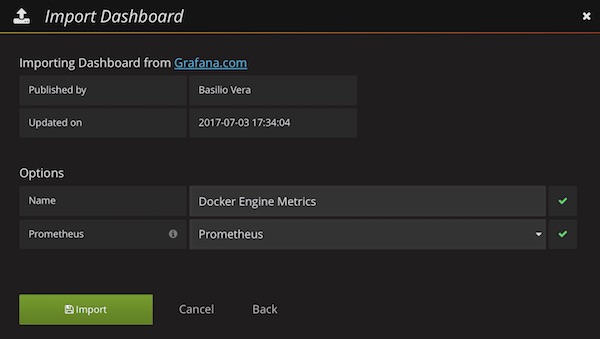
Select already created DataSource (Prometheus) and press “Import” button. Now you should see the awesome Grafana Dashboard.