In previous tutorials I showed the basics for docker monitoring with Prometheus and Jenkins. Here are now the basics with cAdvisor. Many steps are similar and can be implemented just as quickly.
Preparation
# create project
$ mkdir -p Projects/DCIG/influxdb && cd Projects/DCIG/
InfluxDB preparation
This time we start with InfluxDB, because cAdvisor needs it for connection!
# start InfluxDB
$ docker run --name influxdb -p 8086:8086 -v $PWD/influxdb:/var/lib/influxdb influxdb

# create new user
$ curl -G http://localhost:8086/query --data-urlencode "q=CREATE USER cadvisor WITH PASSWORD 'password123' WITH ALL PRIVILEGES"

# create database for cadvisor
$ curl -G http://localhost:8086/query -u cadvisor:password123 --data-urlencode "q=CREATE DATABASE cadvisor_db"

# show ip of influxdb container
$ docker inspect --format '{{ .NetworkSettings.IPAddress }}' influxdb
...
172.17.0.2
...
cAdvisor preparation
Now we will use User, Password and Database name. You can find the documentation here.
# start cAdvisor
$ docker run -d --name=cadvisor -v /:/rootfs:ro -v /var/run:/var/run:rw -v /sys:/sys:ro -v /var/lib/docker/:/var/lib/docker:ro -p 8080:8080 google/cadvisor:latest -storage_driver=influxdb -storage_driver_db=cadvisor_db -storage_driver_user=cadvisor -storage_driver_password=password123 -storage_driver_host=172.17.0.2:8086

# check cAdvisor logs (optional)
$ docker logs -f cadvisor

# open cAdvisor WebUI
$ open -a Safari http://localhost:8080
After a while we can also see if cAdvisor sends metrics to InfluxDB.
# show measurements (be patient)
$ curl -G http://localhost:8086/query -u cadvisor:password123 --data-urlencode "db=cadvisor_db" --data-urlencode "q=SHOW MEASUREMENTS"
prepare and run Grafana
# run grafana container
$ docker run --name grafana -i -p 3000:3000 grafana/grafana

# open Grafana WebUI and login (admin:admin)
$ open -a Safari http://localhost:3000
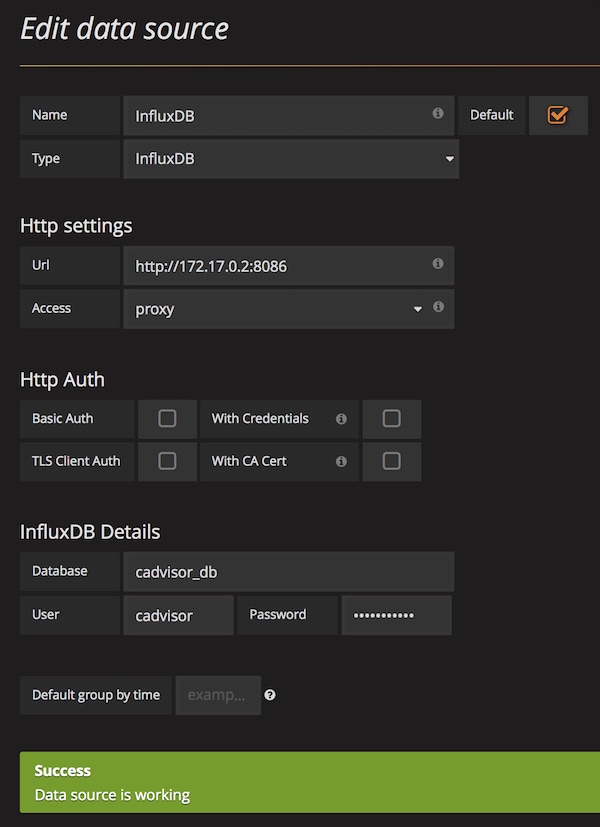
After login (admin:admin) configure new DataSource for InfluxDB.

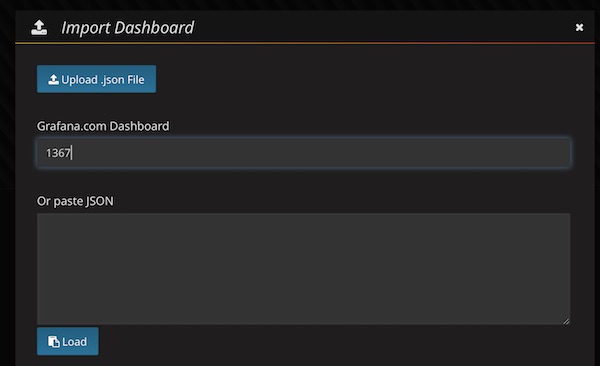
When DataSource is configured we import the Grafana Dashboard. (ID: 1367)

… be patient (don’t press any button) …

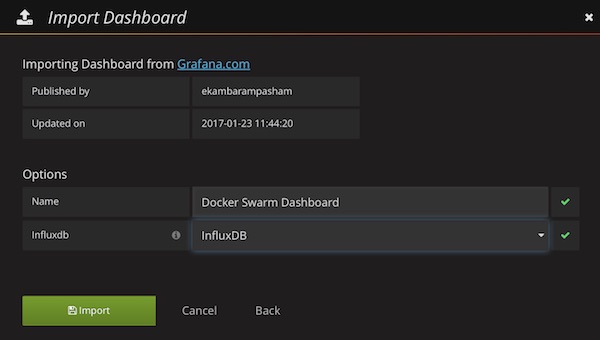
Select already created DataSource (InfluxDB) and press “Import” button. Now you should see the Grafana Dashboard.