Finally, we can create the first dashboard. The prerequisite for this is that you have successfully completed the previous tutorials (Part1, Part2, Part3).
Pipeline graph panel
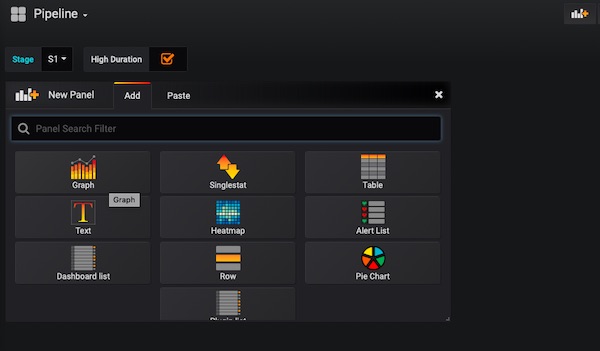
Now go to the still empty dashboard Pipeline. Add the Graph Panel here and select Edit in the title of panel.
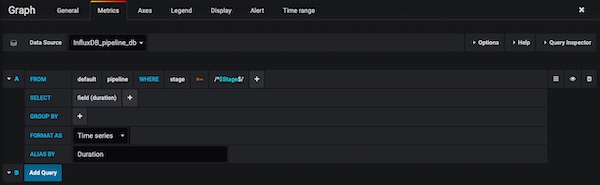
In the Metrics tab you now enter the following values. Data Source: InfluxDB_pipeline_db, From: default, pipeline, WHERE: stage =~ /^$Stage$/, SELECT: field(duration), FORMAT AS: Time series and ALIAS BY: Duration.
Note: In case your graph is not displayed correctly, select on the Time picker dropdown: Last 30 days.
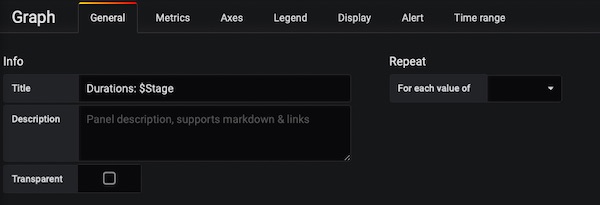
Change to General tab and enter for Title: Duration: $Stage.
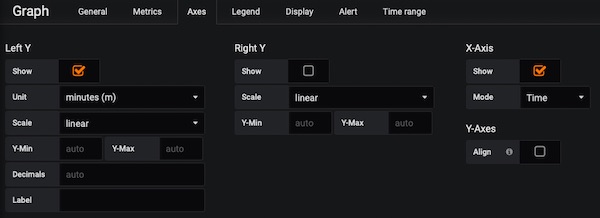
Change to Axes tab and enable checkboxes Show for Left Y and X-Axis. The Unit value for Left Y should be: minutes(m).
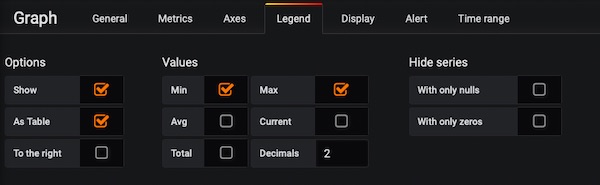
Under tab Legend choose enable following checkboxes: Show, As Table, Min and Max. For Decimals enter value “2”.
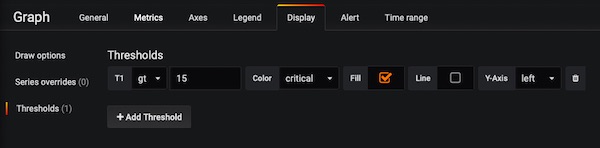
Our last action for the Graph panel will be done in tab Display. Here we add the Threshold. T1: gt, 15, Color critical, enable checkbox Fill and Y-Axis: left.
We are done with Graph panel … don’t forget to save!
Pipeline singlestat panel (Last Status)
Now we add 2 more singlestat panels. One should show the Last Status and the other Last Duration. Press Edit for Last Status panel.

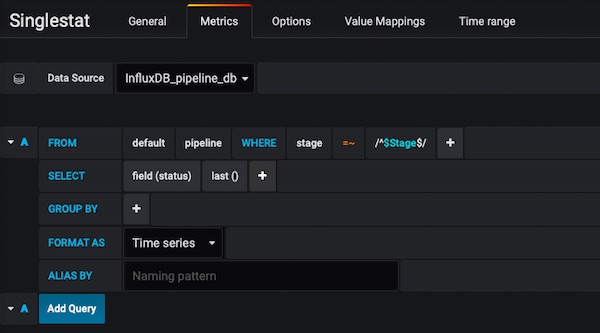
In the Metrics tab you now enter the following values. Data Source: InfluxDB_pipeline_db, From: default, pipeline, WHERE: stage =~ /^$Stage$/, SELECT: field(status)last() and FORMAT AS: Time series.
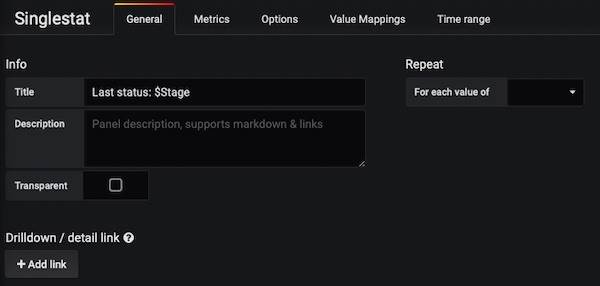
Change to General tab and enter for Title: Last status: $Stage.
Close Panel edit mode and save.
Pipeline singlestat panel (Last Duration)
Last Singlestat will have following Metrics. Data Source: InfluxDB_pipeline_db, From: default, pipeline, WHERE: stage =~ /^$Stage$/, SELECT: field(duration) and FORMAT AS: Time series. Under tab General just add Title: Last Duration: $Stage.
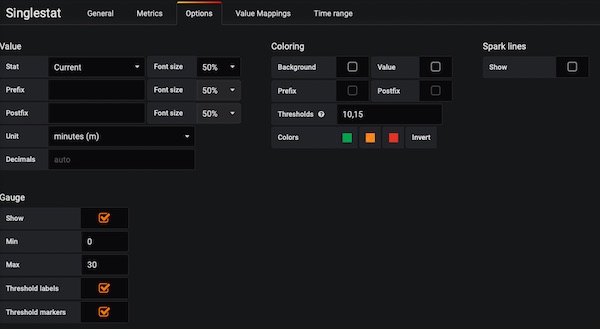
For tab Options select Stat: Current, Font size: 50%, Unit: minutes(m), Thresholds: 10,15, enable checkbox Show for Gauge, Min: 0, Max: 30 and enable checkboxes Threshold labels plus Threshold markers. Close Edit mode and save.
Final Pipeline Dashboard
Now you can play with the size and placement of the panels. My Pipeline dashboard now looks like this:
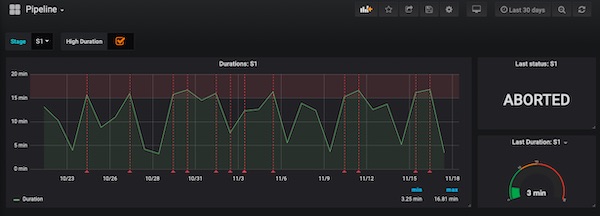
If you change the variables (S1, S2, S3), the values of the panels should change.
This leaves only 2 dashboards left. See you in next tutorial.