In the third part of this tutorial series we will create Query Variables and Annotations for our three Dashboards (Testing, Support, Pipeline). Thus, we can later provide interactive dashboards (instead of static ones). Stakeholders should be able to independently filter or select information, which makes the Grafana dashboards more interesting.
Note: This part assumes that you have completed the first and second part successfully.
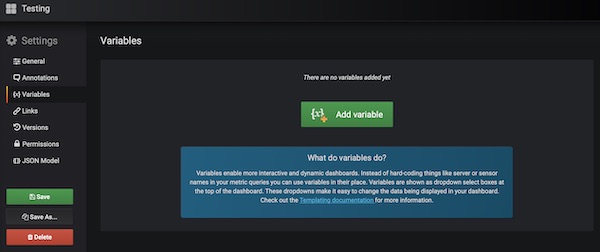
Variables for dashboard Testing
For Dashboard Testing we need a query variable: QA. Go to the Dashboard Settings on Testing. Now select the “Add variable” button in the “Variables” category.
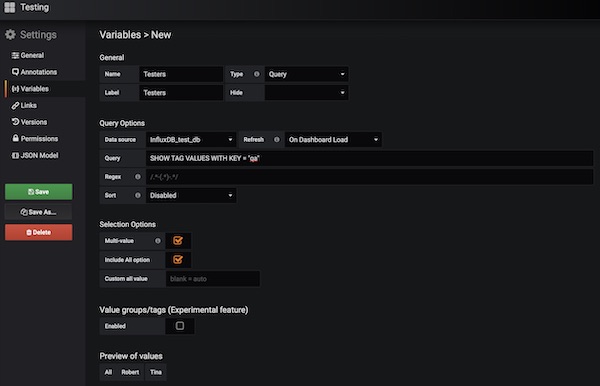
Assign a unique name and label: Testers, select as Type: Query, Data source: InfluxDB_test_db and Refresh: On Dashboard Load. As Query insert: SHOW TAG VALUES WITH KEY = “qa”. In the Preview you should see already all values. Last enable checkboxes for Multi-value and Include all value. Press “Add” and “Save” buttons when you’r done.
On the empty dashboard should now be a dropdown, with the values visible.
Variables and annotations for dashboard Support
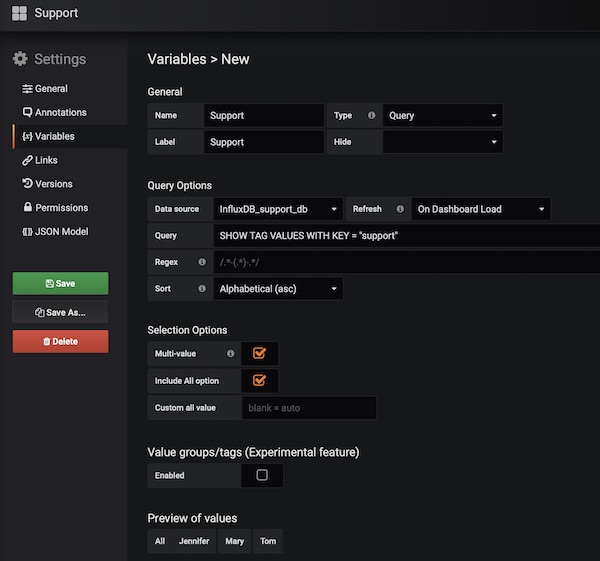
For Dashboard Support we need a query variable: Support. Assign a unique name and label: Support, select as Type: Query, Data source: InfluxDB_support_db, Refresh: On Dashboard Load and Sort: Alphabetical (asc). As Query insert: SHOW TAG VALUES WITH KEY = “support”. In the Preview you should see already all values. Last enable checkboxes for Multi-value and Include all value. Press “Add” and “Save” buttons when you’r done.
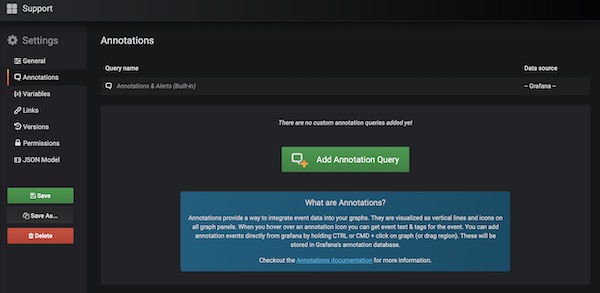
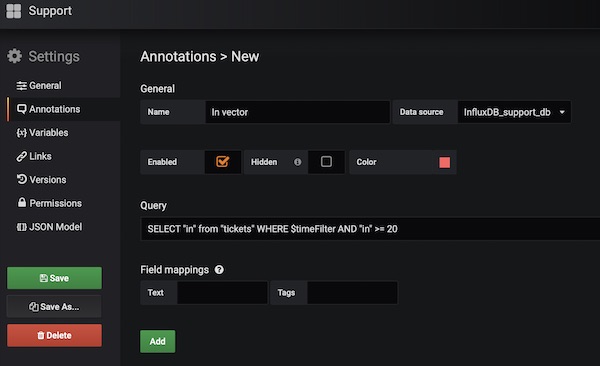
In addition, this dashboard should also have an annotation. Select the “Add Annotation Query” button in the “Annotations” category.
Give name: In vector, select Data source: InfluxDB_support_db, enable checkbox: Enabled and add Query: SELECT FROM “in” FROM “tickets” WHERE $timeFilter AND “in” >= 20. Press button’s “Add” and “Save”.
On the empty dashboard should now be a dropdown and a checkbox.
Variables and annotations for dashboard Pipelines
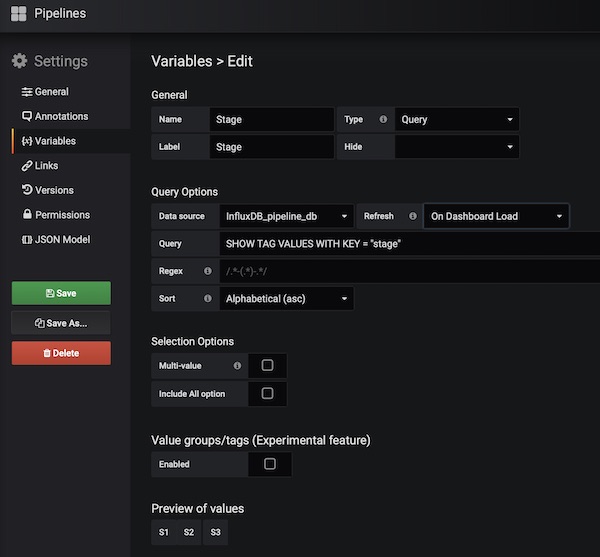
Our last dashboard Pipelines will have a variable and annotation, too. Create therefore a variable with following configuration. Name/Label: Stage, Type: Query, Data source: InfluxDB_pipeline_db, Refresh: On Dashboard Load, Query: SHOW TAG VALUES WITH KEY = “stage” and Sort: Alphabetical (asc). Press buttons “Add” and “Save”.
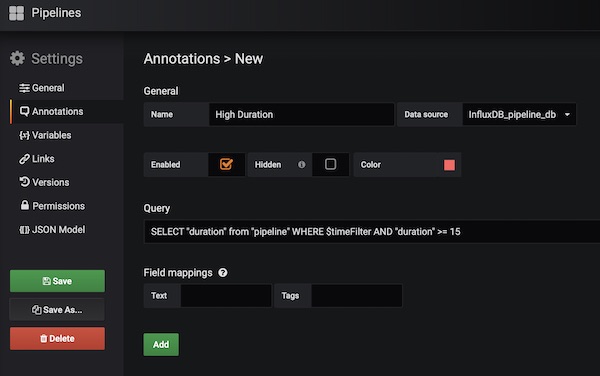
For the annotation give following values. Name: High Duration, Data source: InfluxDB_pipeline_db, Enabled and Query: SELECT “duration” FROM “pipeline” WHERE $timeFilter AND “duration” >= 15. Press “Add” and “Save”.
On the empty dashboard should now be a dropdown and a checkbox.
Okay … that’s it for the third part. In the 4th part we will finally add the pannels in the respective dashboards.