In the first part of this tutorial series, you created the environment and recorded some fictional data into InfluxDB. Now log in to Grafana and create data sources for your dashboard pannels.
The next steps will only be performed if you have stopped the environment via docker-compose stop.
# go to Project directory
$ cd ~/Projects/GrafanaDemo/

# start environment
$ docker-compose start

# open Grafana in browser (and login)
$ open http://localhost:3000
You should now find yourself on the Home Dashboard.
Data Sources
The first step is to create the InfluxDB data sources for the metrics to be available in Grafana. To do this, navigate to Data Sources now.
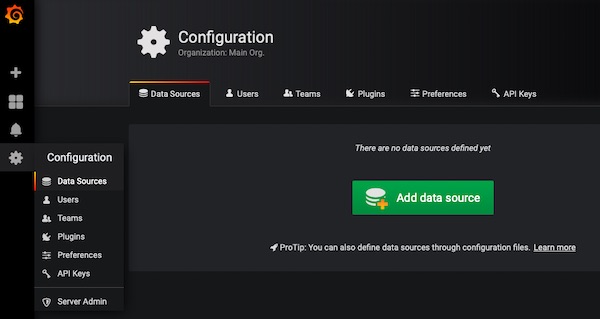
Now click on “Add data source”. We will do this step 2 more times. For each database (test_db, support_db, pipeline_db) in InfluxDB we will specify a separate connection.
Assign a unique name (like InfluxDB_test_db), select as Type: InfluxDB, enter the URL: http://10.1.0.10:8086, select Access: Server (Default) and Database: test_db. Finally, press the “Save & Test” button. Additional values are not necessary for this tutorial.
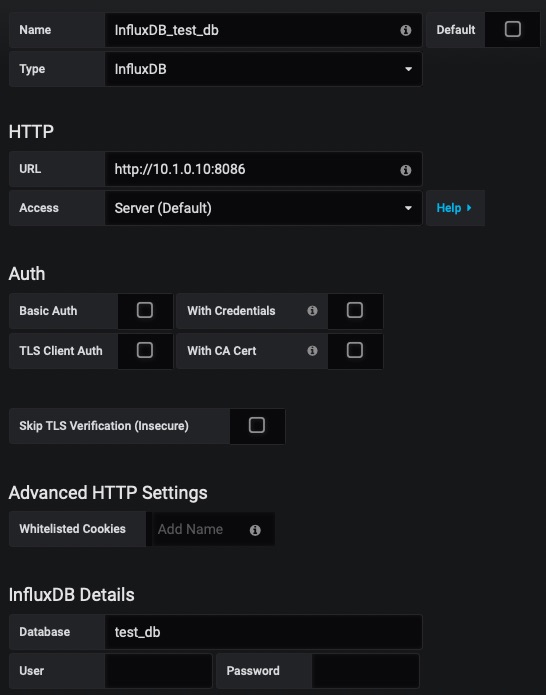
If everything went well, you should get the hint “Data source is working.”
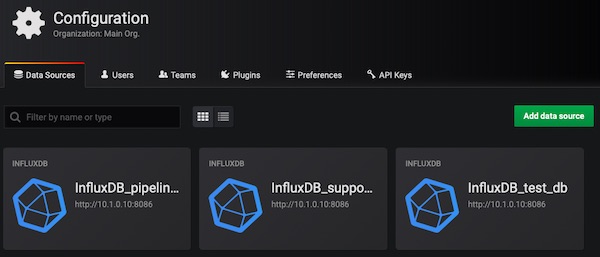
Repeat the process for the other two InfluxDB databases (support_db, pipeline_db). Pay attention to the values of name and database. In the end, your configuration should look like this:
Dashboards
In this step, you will now create three empty dashboards (under General). Similar to the Data Sources – one for each database. Switch to Manage – Dashboards.

Select the “+ Dashboard” button. Before adding panels, give the dashboard a unique name. To do this, select the “Settings” icon (top right).
Give the name value, for example “Testing” and for Timezone choose: Local Browser Time. Finally, press the “Save” button.
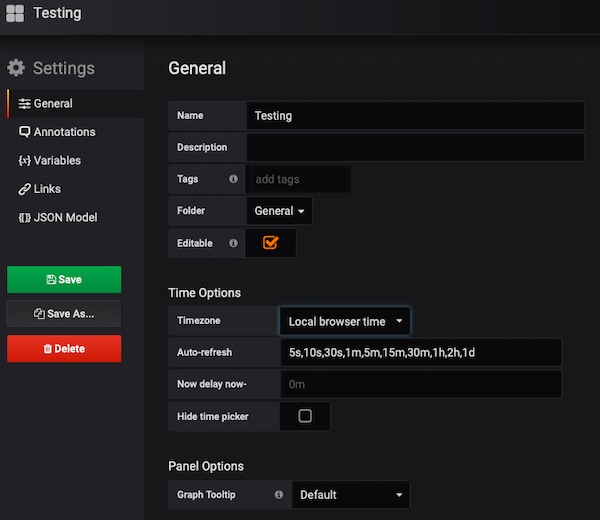
Repeat the process 2 more times. In the end, you should have created 3 empty dashboards (eq. Testing, Support and Pipelines).
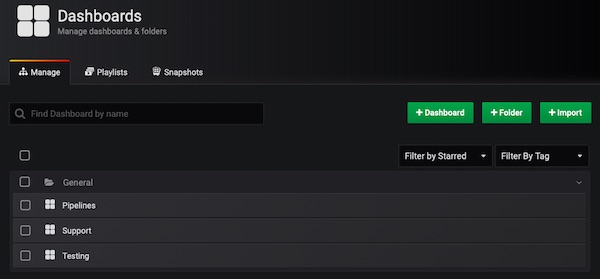
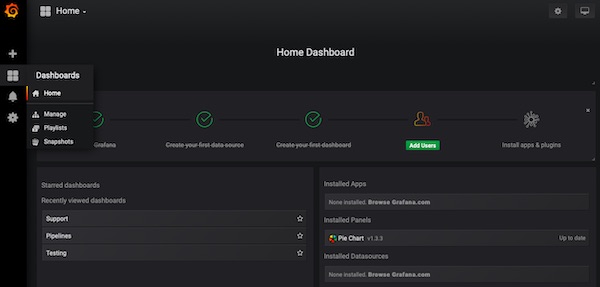
Perfect, you should now be able to see your 3 dashboards on the “Home Dashboard”.
In the third part of the series, you will learn to create annotation and variables for each dashboard. I hope you had fun and that you have been able to learn something new till here. See you soon in 3rd part.