In the last tutorial of this series, we create the dashboards for testing and support. Part 1, Part 2, Part 3 and Part 4 should have been successfully completed.
Dashboard Testing
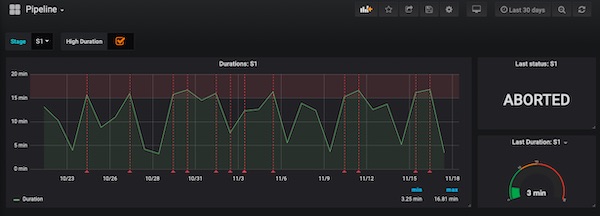
First, I show the result. With a little Drag & Drop and resizing, your dashboard might look like this. But after all, it’s up to your creativity how the results look.
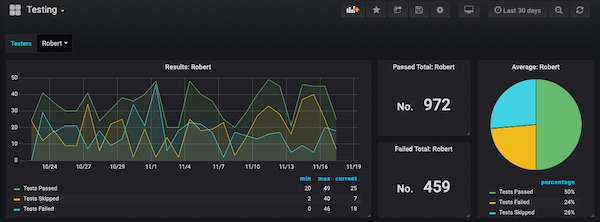
I will just show now the most important configurations, from the 4th part you should already know the others.
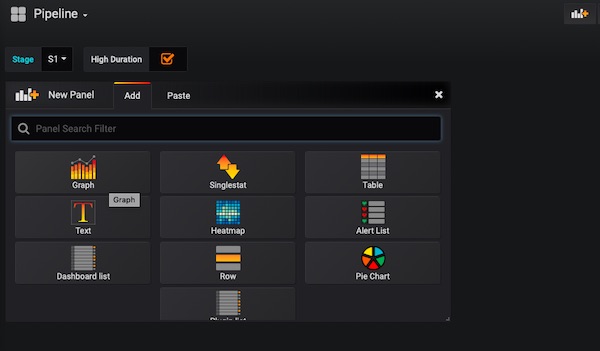
Add following panels. 1x Graph panel, 2x Singlestat panel and 1x Pie Chart panel. Now edit the Graph panel.
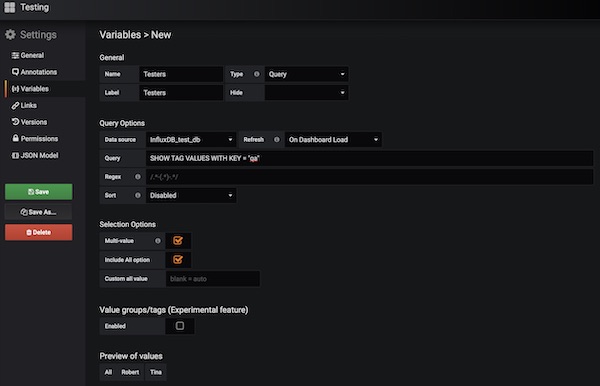
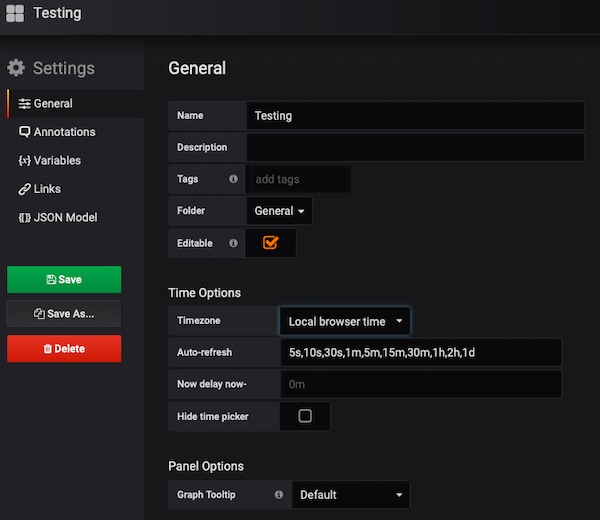
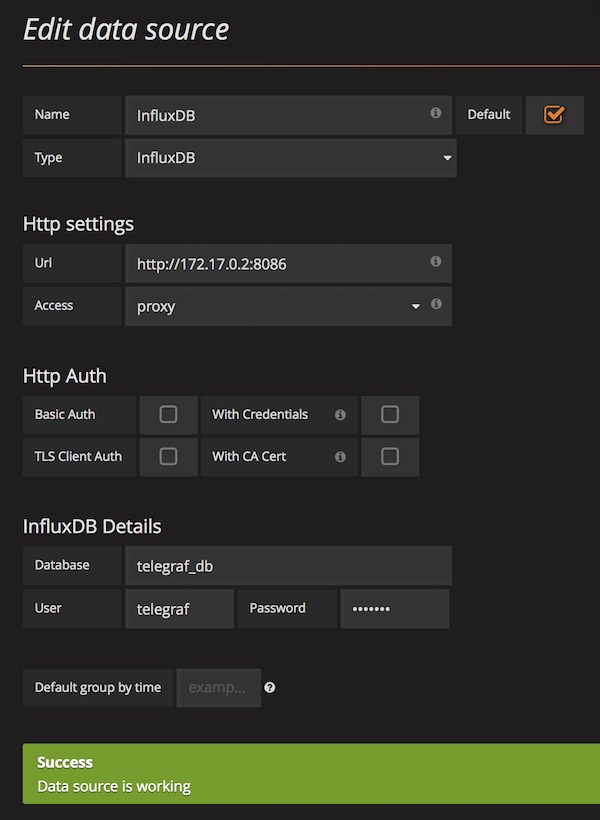
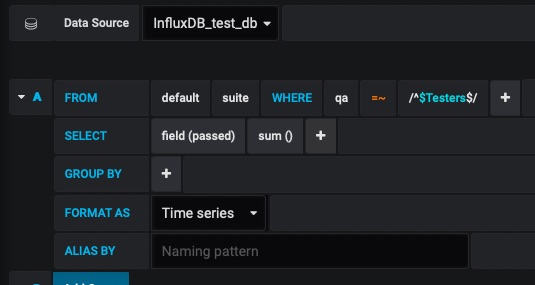
Under tab General enter for Title: Results: $Testers. On tab Metrics select Data Source InfluxDB_test_db and enter From: default suite WHERE: qa =~ /^$Testers$/, SELECT: field(passed) alias(Test Passed) field(skipped) alias(Tests Skipped) field(failed) alias(Tests Failed), FORMAT AS: Time series and ALIAS BY: $col.
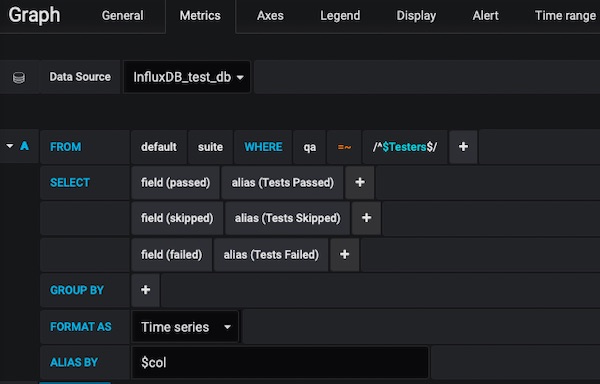
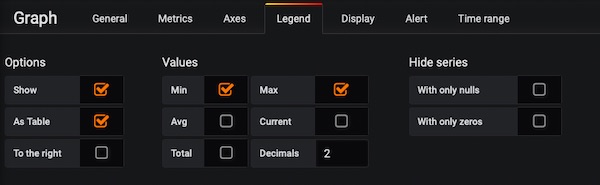
For tab Axes just enable Show checkbox on Left Y and X-Axis, Unit: short, Scale: linear and Mode: Time. On tab Legend enable checkboxes Show, As Table, Min, Max and Current. On tab Display enable only checkbox Lines.
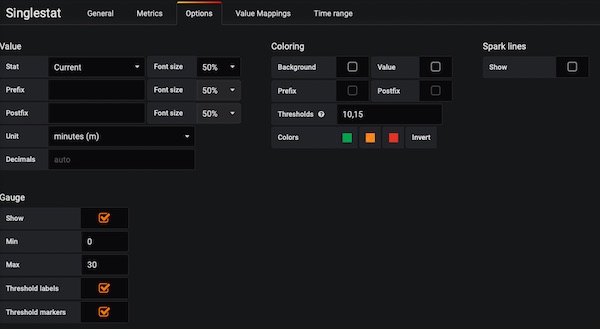
Now you can edit the Singlestat panels (one after the other). Here the important screens for Passed Total: $Testers:
Tab Options (Singlestat)
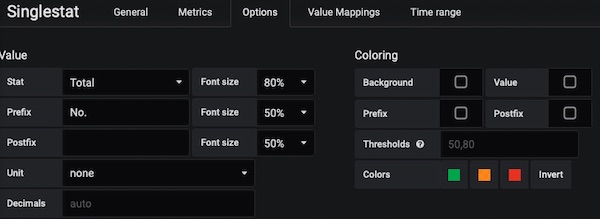
For Singlestat Failed Total: $Testers, just change field(passed) to field(failed).
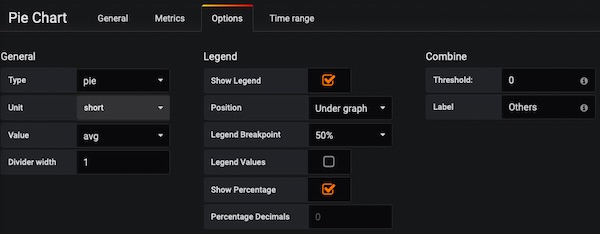
The Pie Chart Average: $Testers is simple, too. Here are the most important settings.
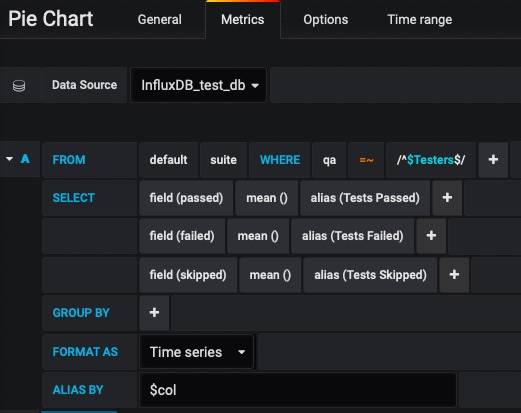
Tab Options (Pie Chart)
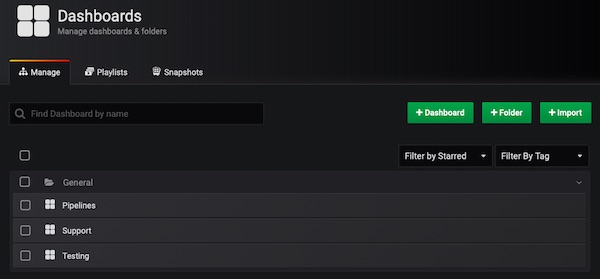
You’re done with 2nd dashboard. Don’t forget to save (incl. variables and so on)!
Dashboard Support
Let’s get to the last dashboard (Support). Again, the result.
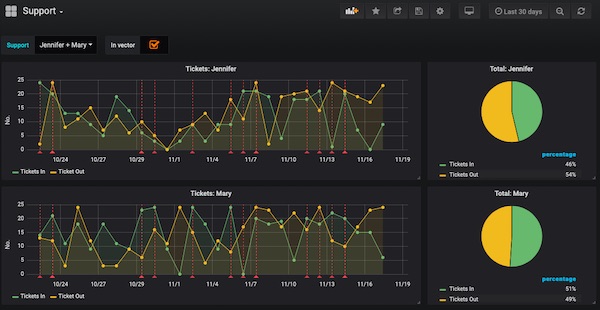
Now add the following panels. 1x Graph panel and 1x Pie Chart panel (we dynamically generate the others).
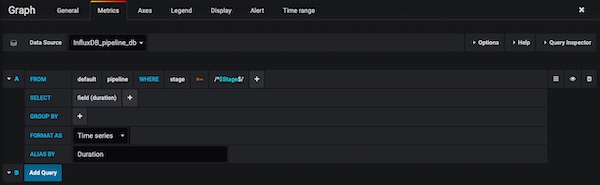
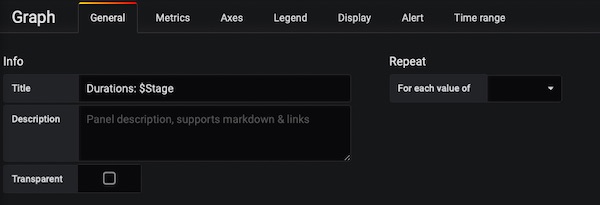
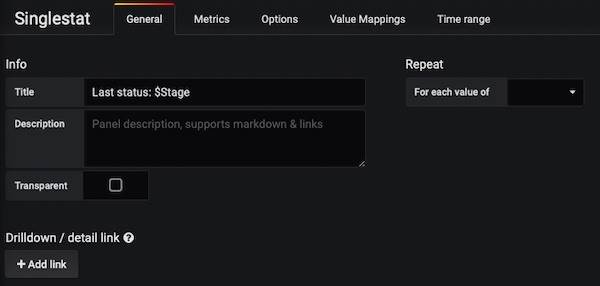
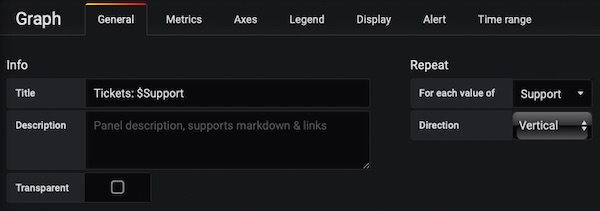
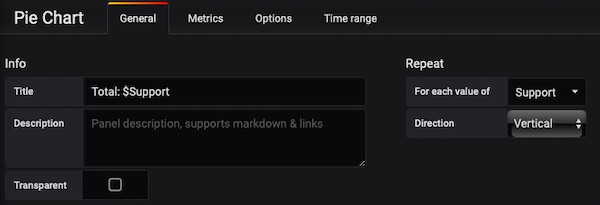
Here now the important settings. On tab General have attentions to Repeat!
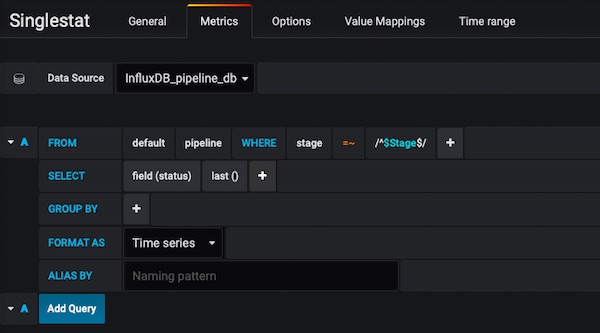
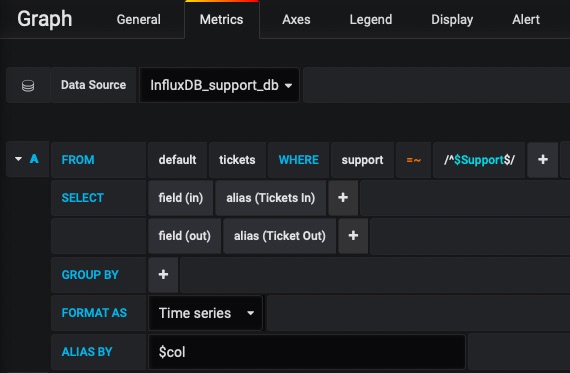
Tab Metrics (Graph)
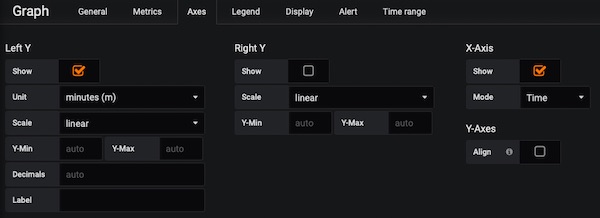
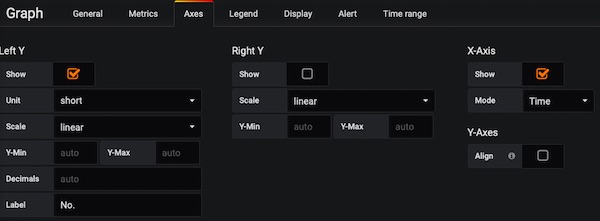
Tab Axes (Graph)
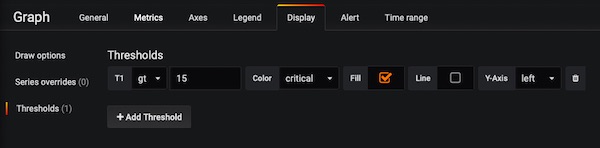
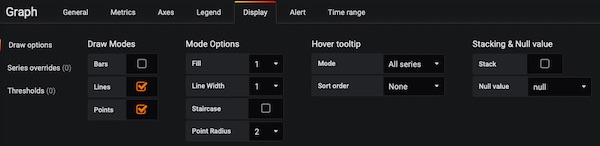
Tab Display (Graph)
The tab Legend for Graph panel have only Show checkbox enabled. Let’s go to the Pie Chart settings. On tab General have attentions to Repeat!
Tab Metrics (Pie Chart)

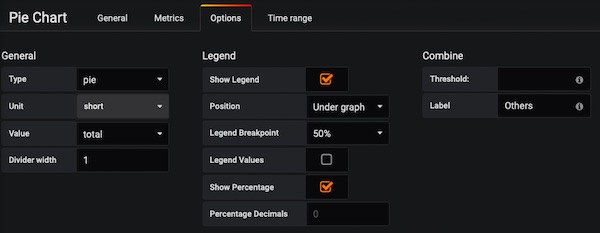
Tab Options (Pie Chart)
That’s it with this series. I hope you have all the knowledge to create with Grafana awesome QA dashboards.